Workbench
Workbench is the product. Sign in at https://workbench.eresussec.com.
This marketing site is not in the auth path. Reconnect keeps the screen you were on: Dashboard, Findings, HTTP Records, Admin.
The left navigation is the map. It is grouped the same way the work is grouped.
Overview
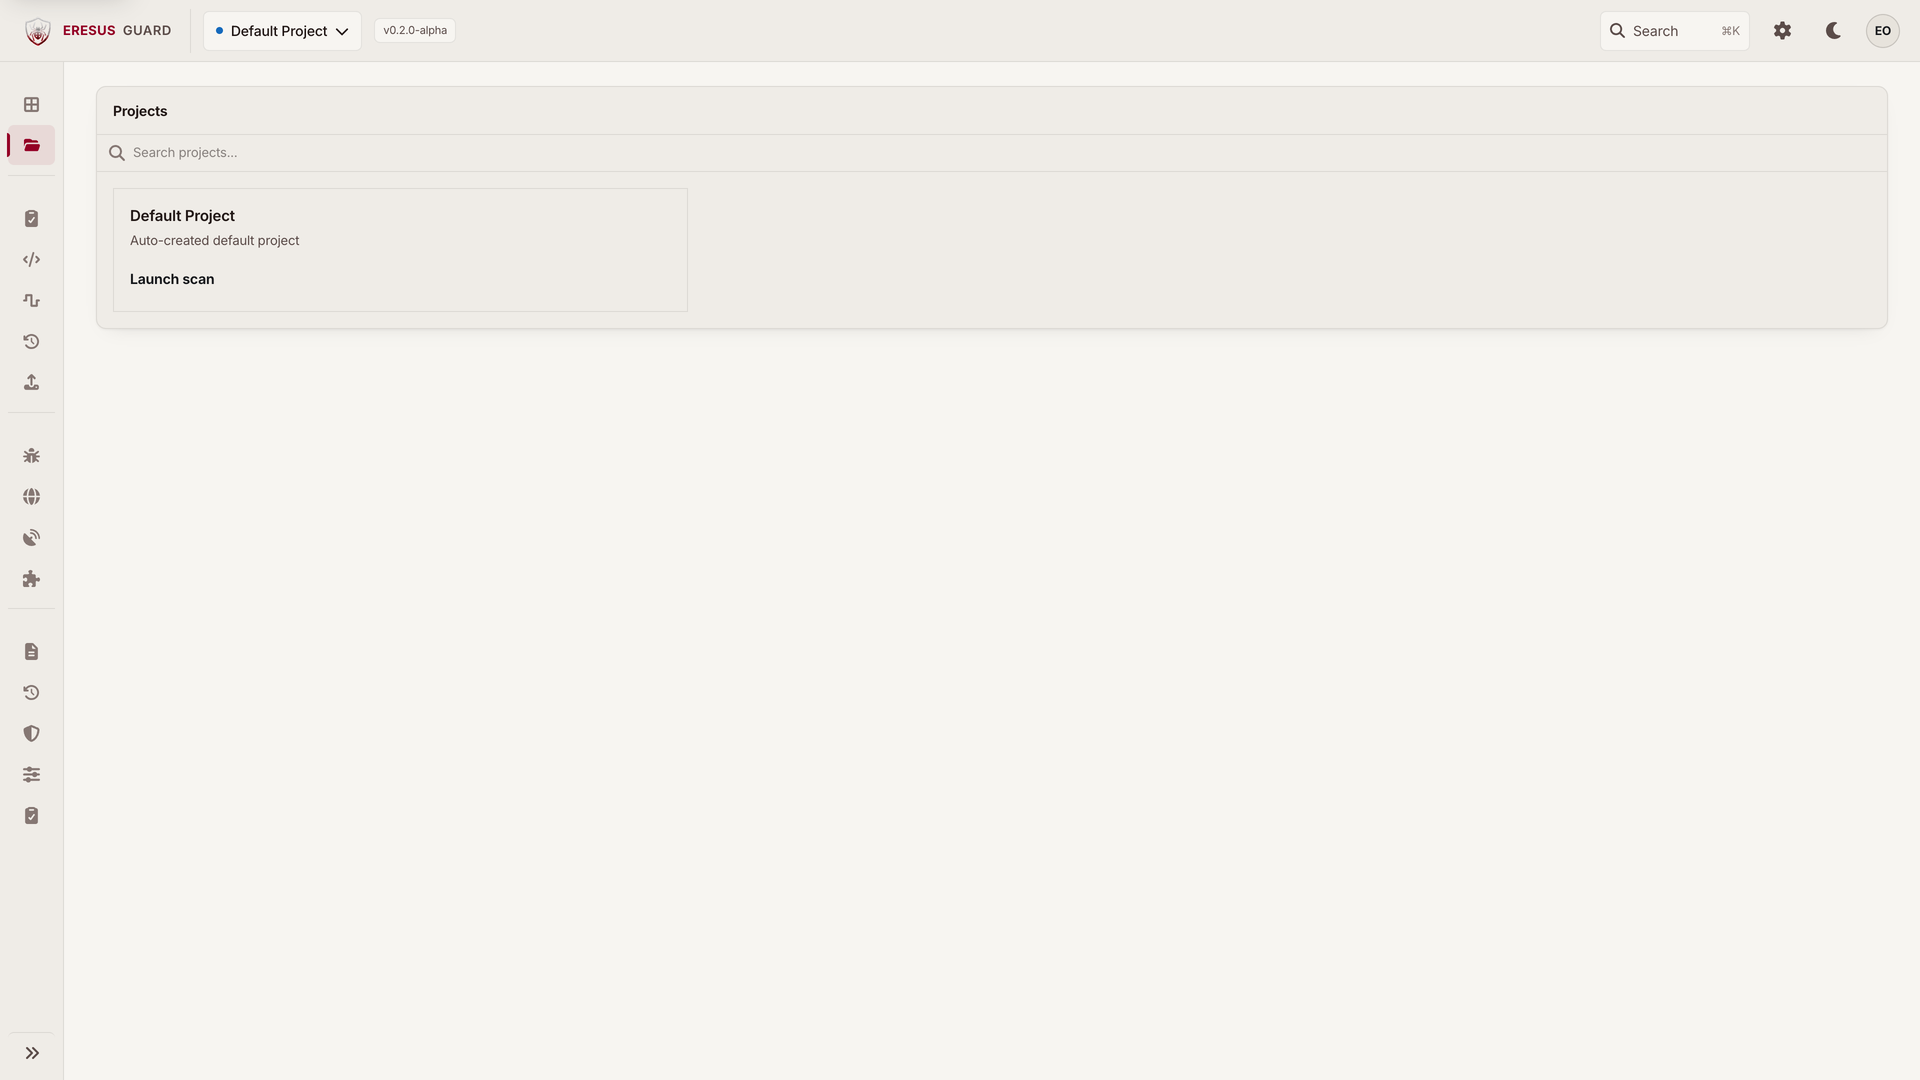
Dashboard is the current project. It shows risk posture (Critical / High / Medium / all recorded findings), immediate actions when something is waiting, latest findings, a live assessment pipeline when a scan is running, and recent OAST callbacks. Last successful assessment and active status sit in the header. Start assessment launches New Scan for that project.
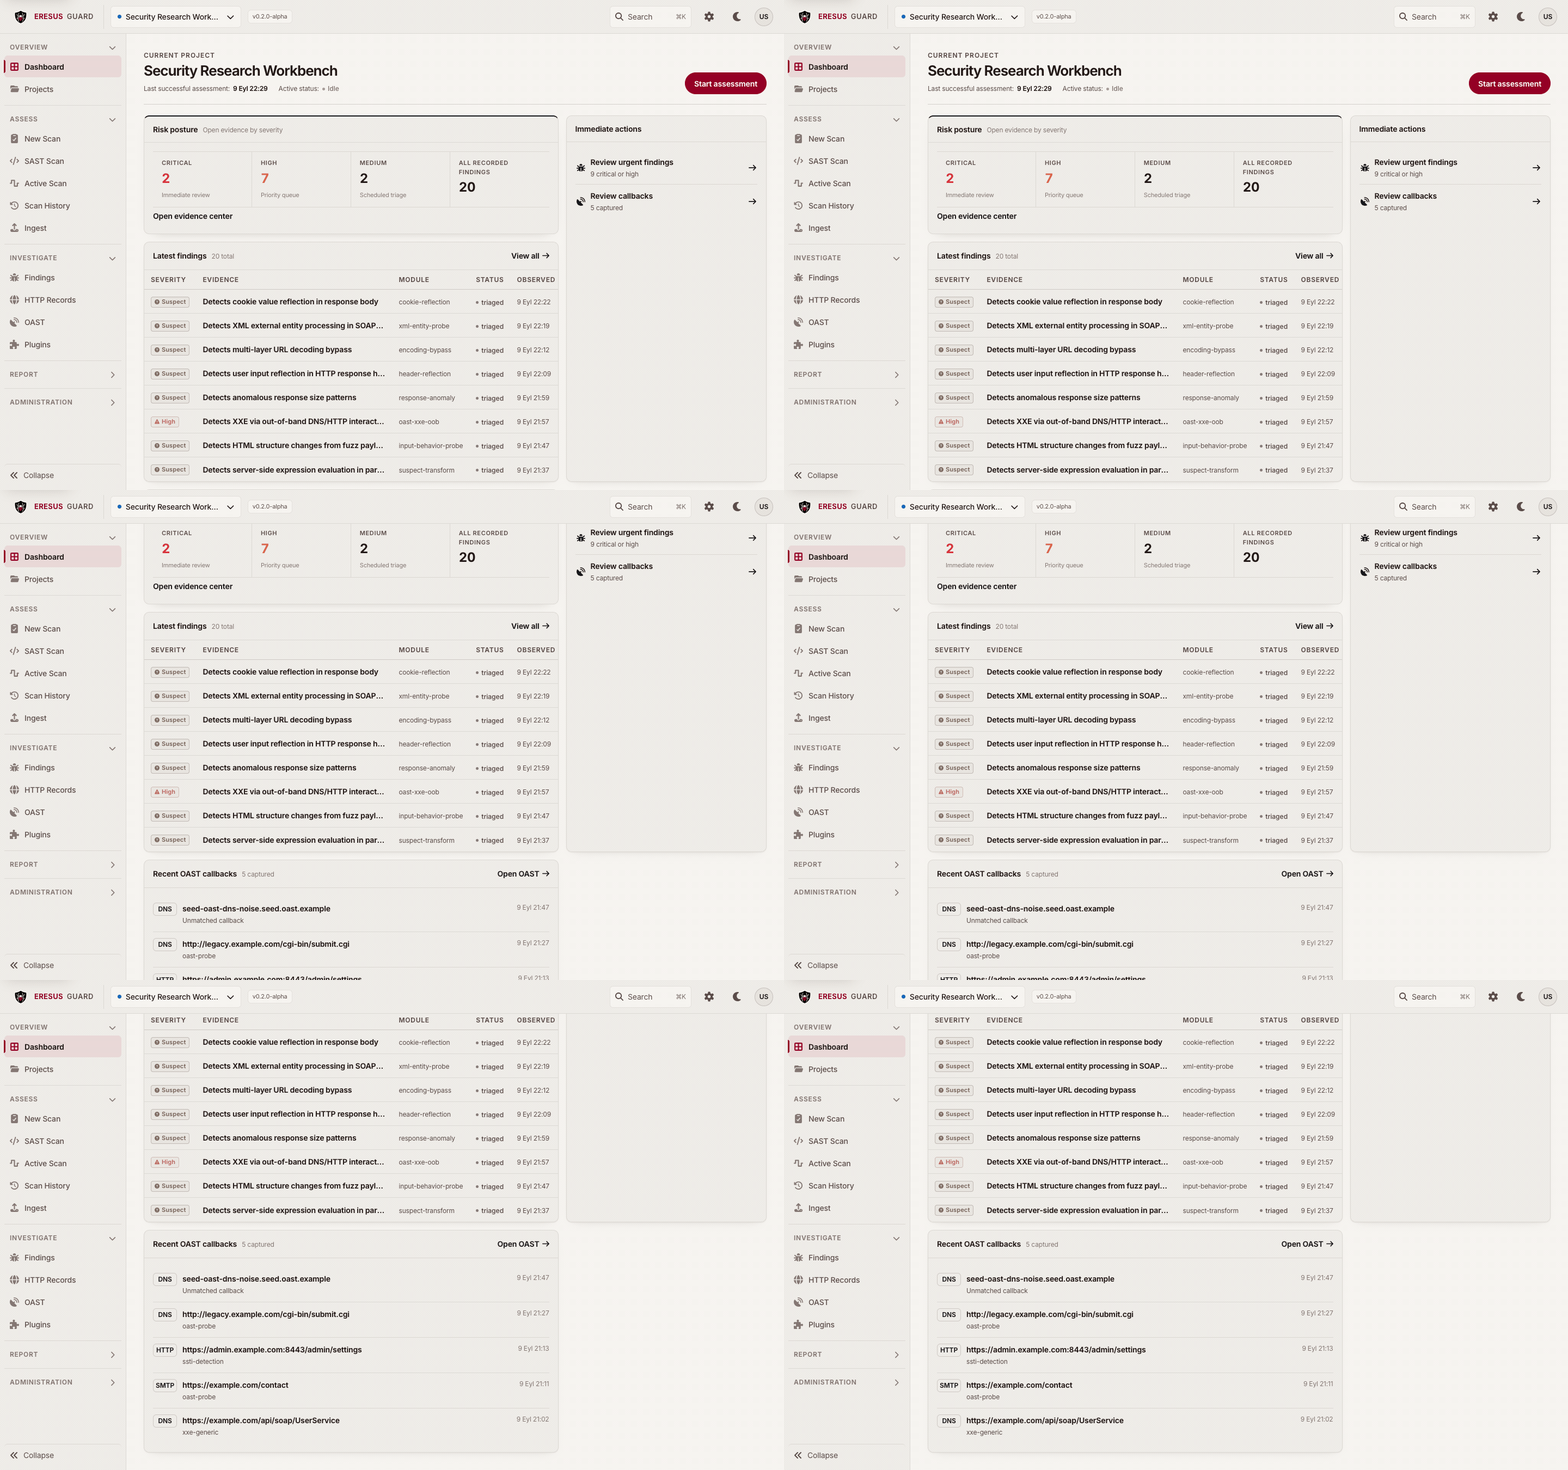
Projects is the portfolio. Create or select the project that owns the target before you scan. Scans, findings, HTTP records, and scope do not float across projects.
Assess
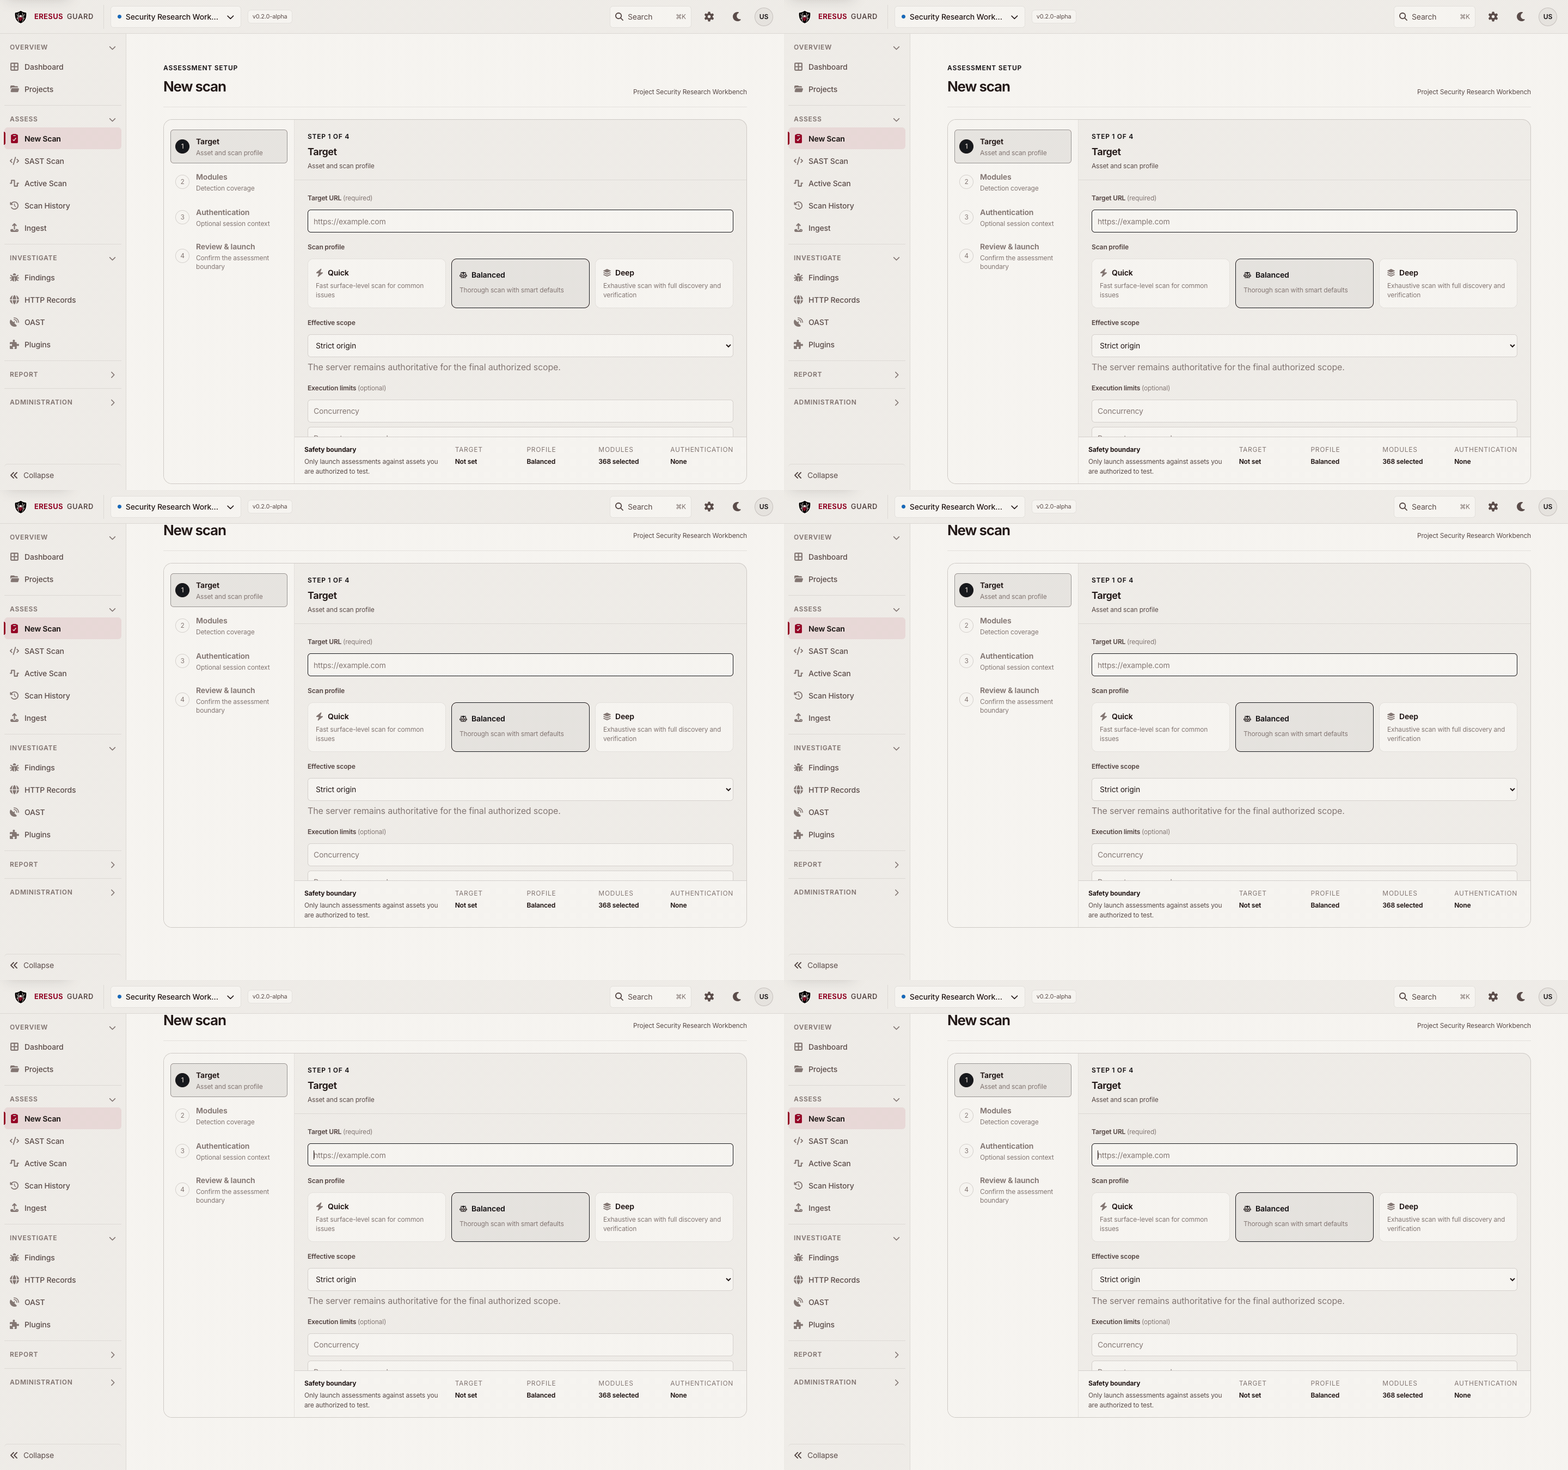
New Scan is authorized web and API DAST. You confirm the project, the target, profile, modules, and authentication before the run starts. A discovered link is an observation, not an automatic scope change.
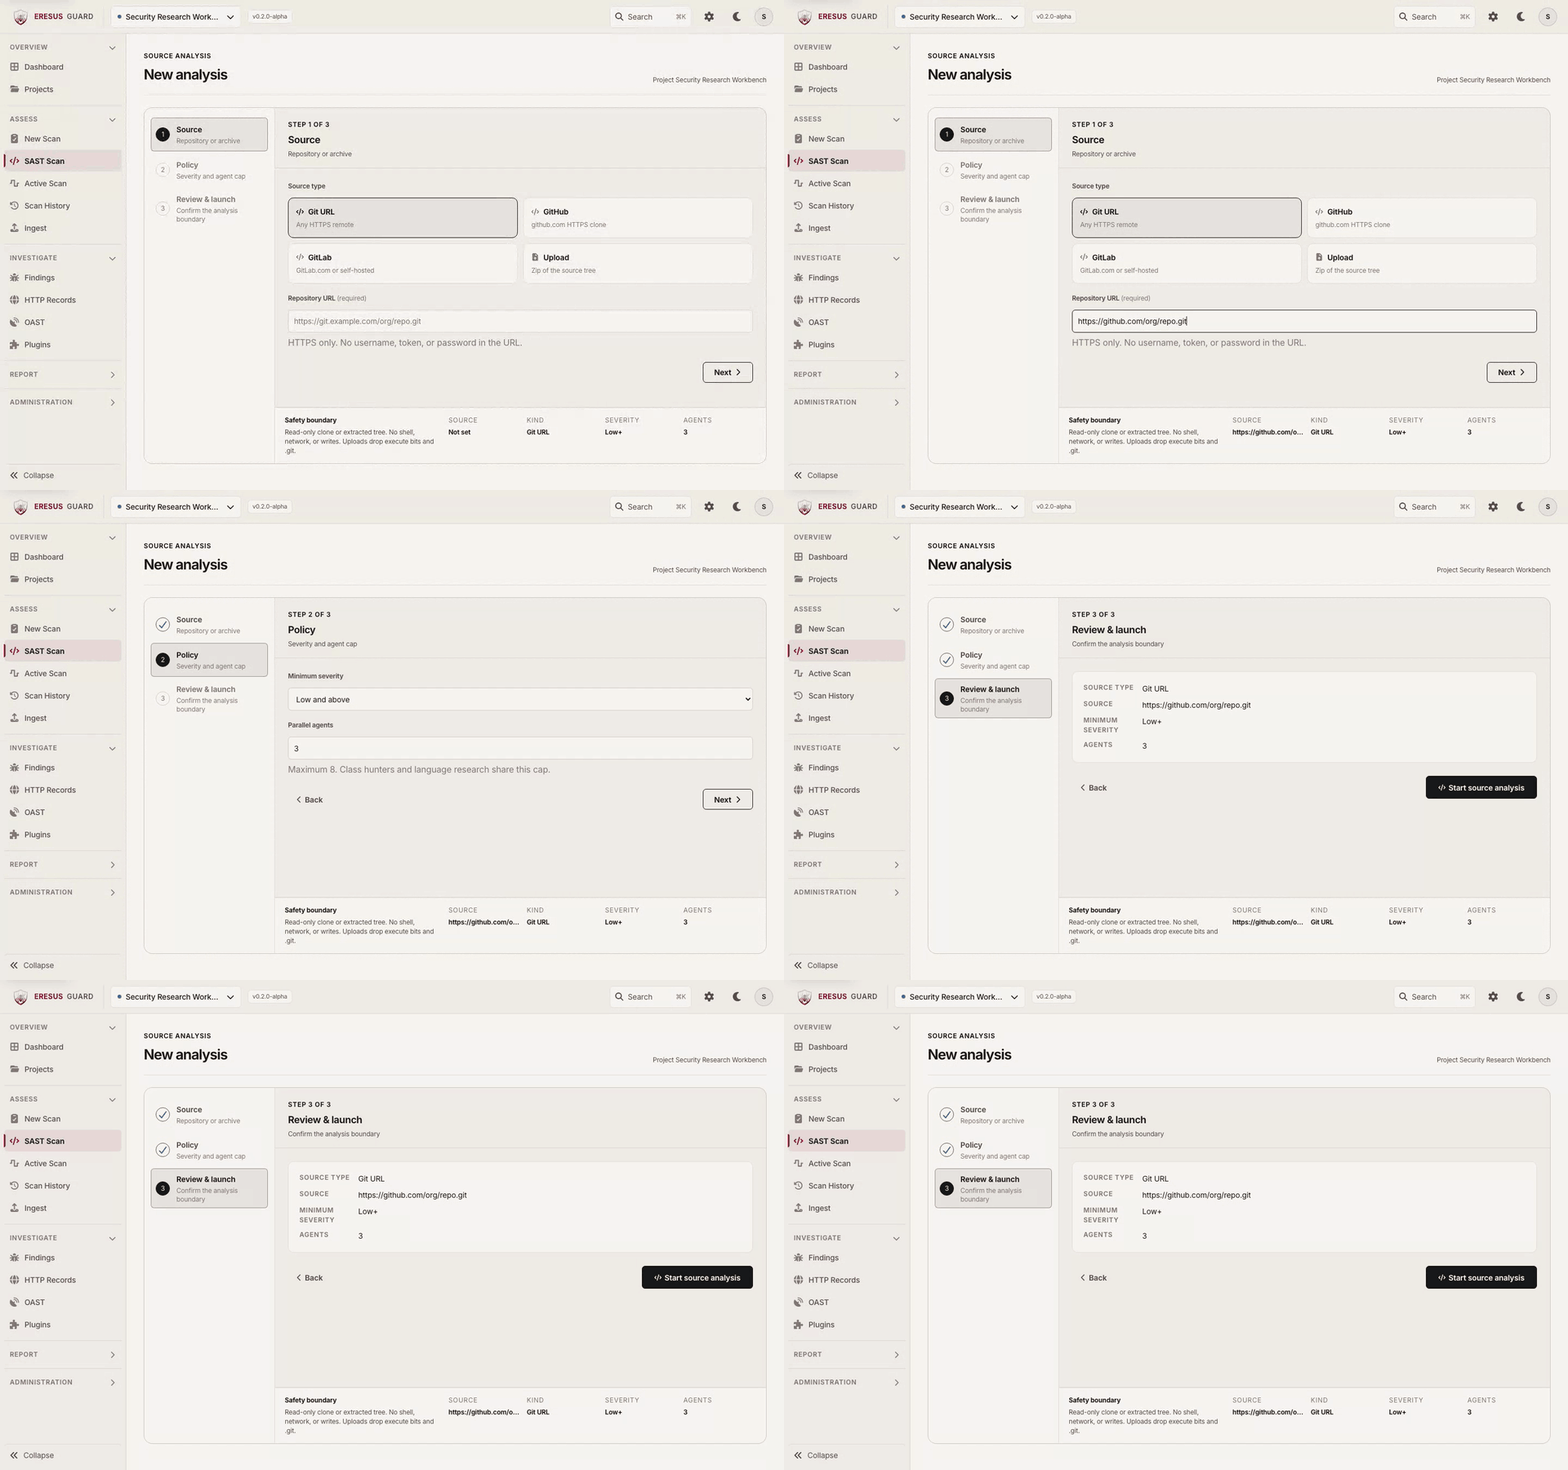
SAST Scan is source analysis on a pinned snapshot: credential-free HTTPS repository, connected repository, or upload. It is not a live-target setup screen.
Active Scan is the run in progress. Processed-record count and status live here. Pause or stop from Workbench if the target becomes unstable.
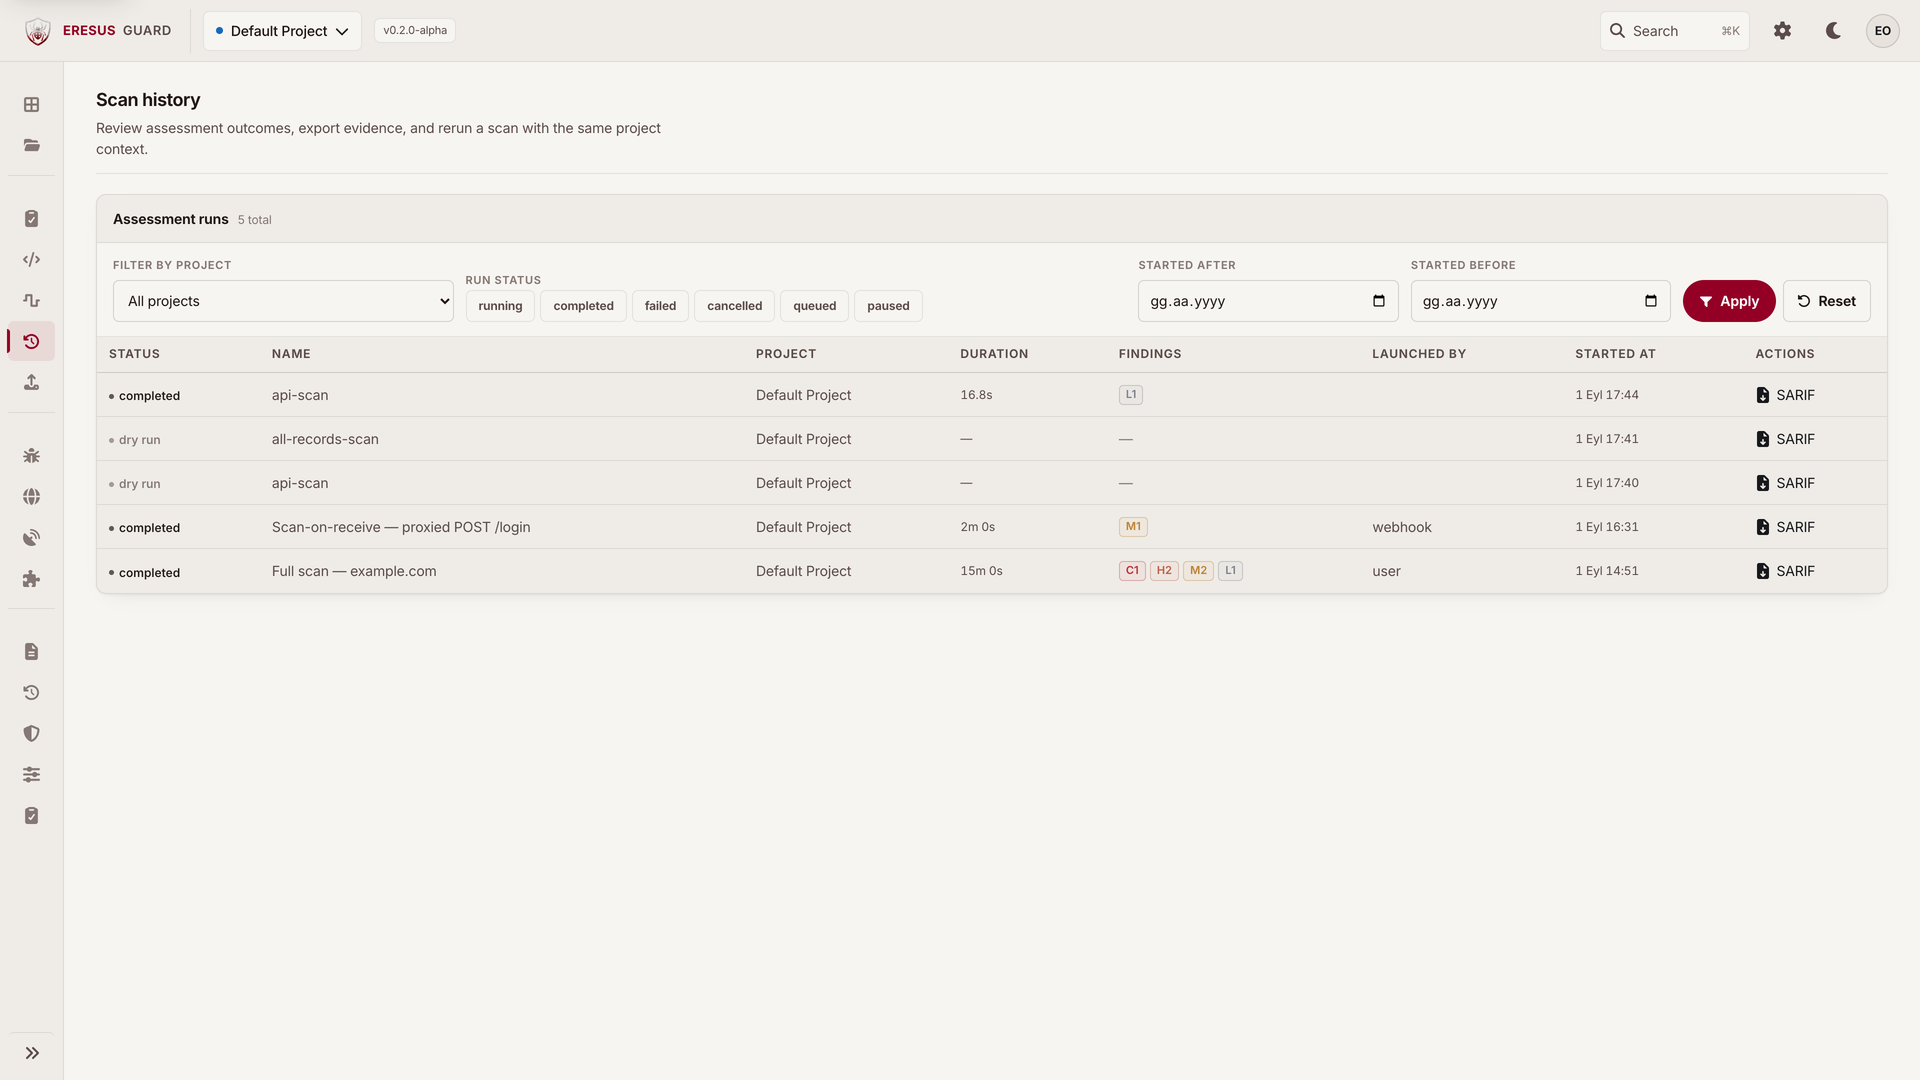
Scan History is every finished or stopped run in the project: status, duration, findings, re-run, SARIF export when your plan includes it.
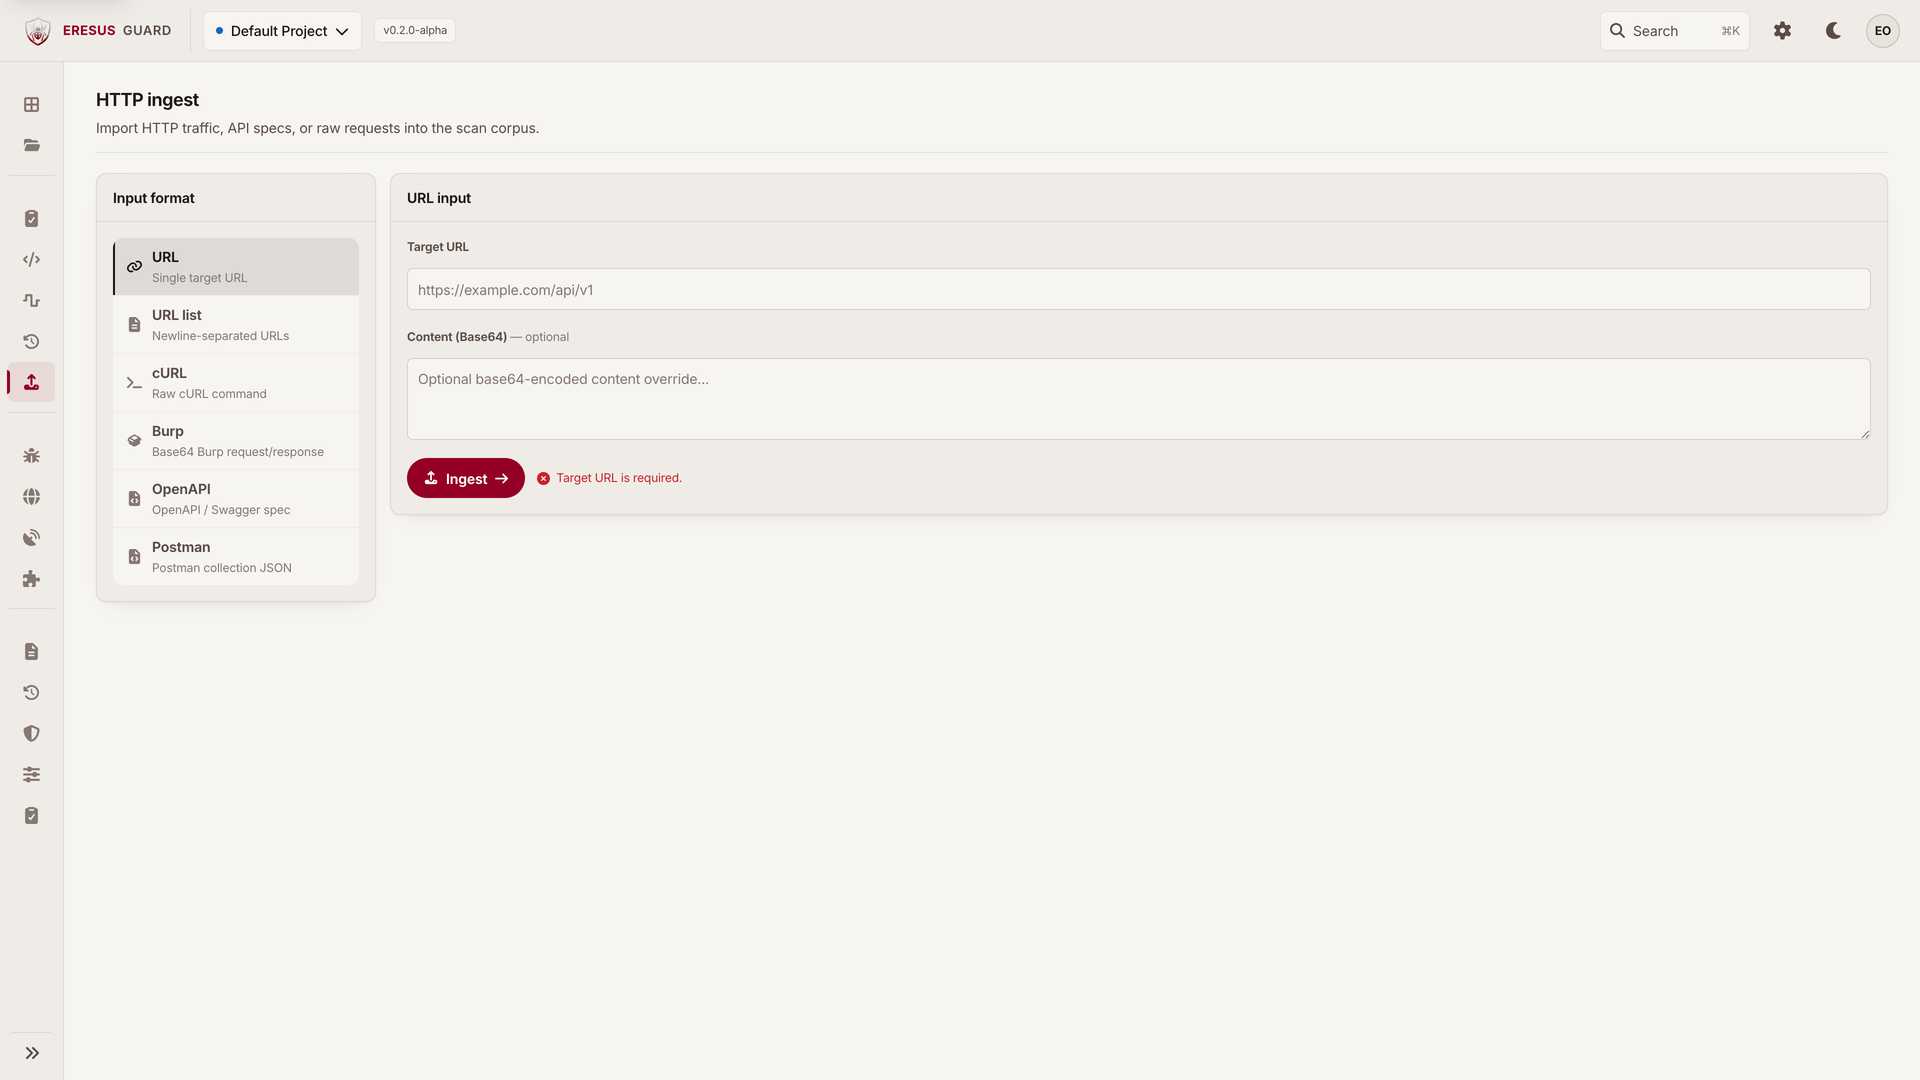
Ingest accepts URL, URL list, cURL, captured HTTP, OpenAPI, or Postman. Whatever you paste lands in the same project and the same evidence pipeline.
Investigate
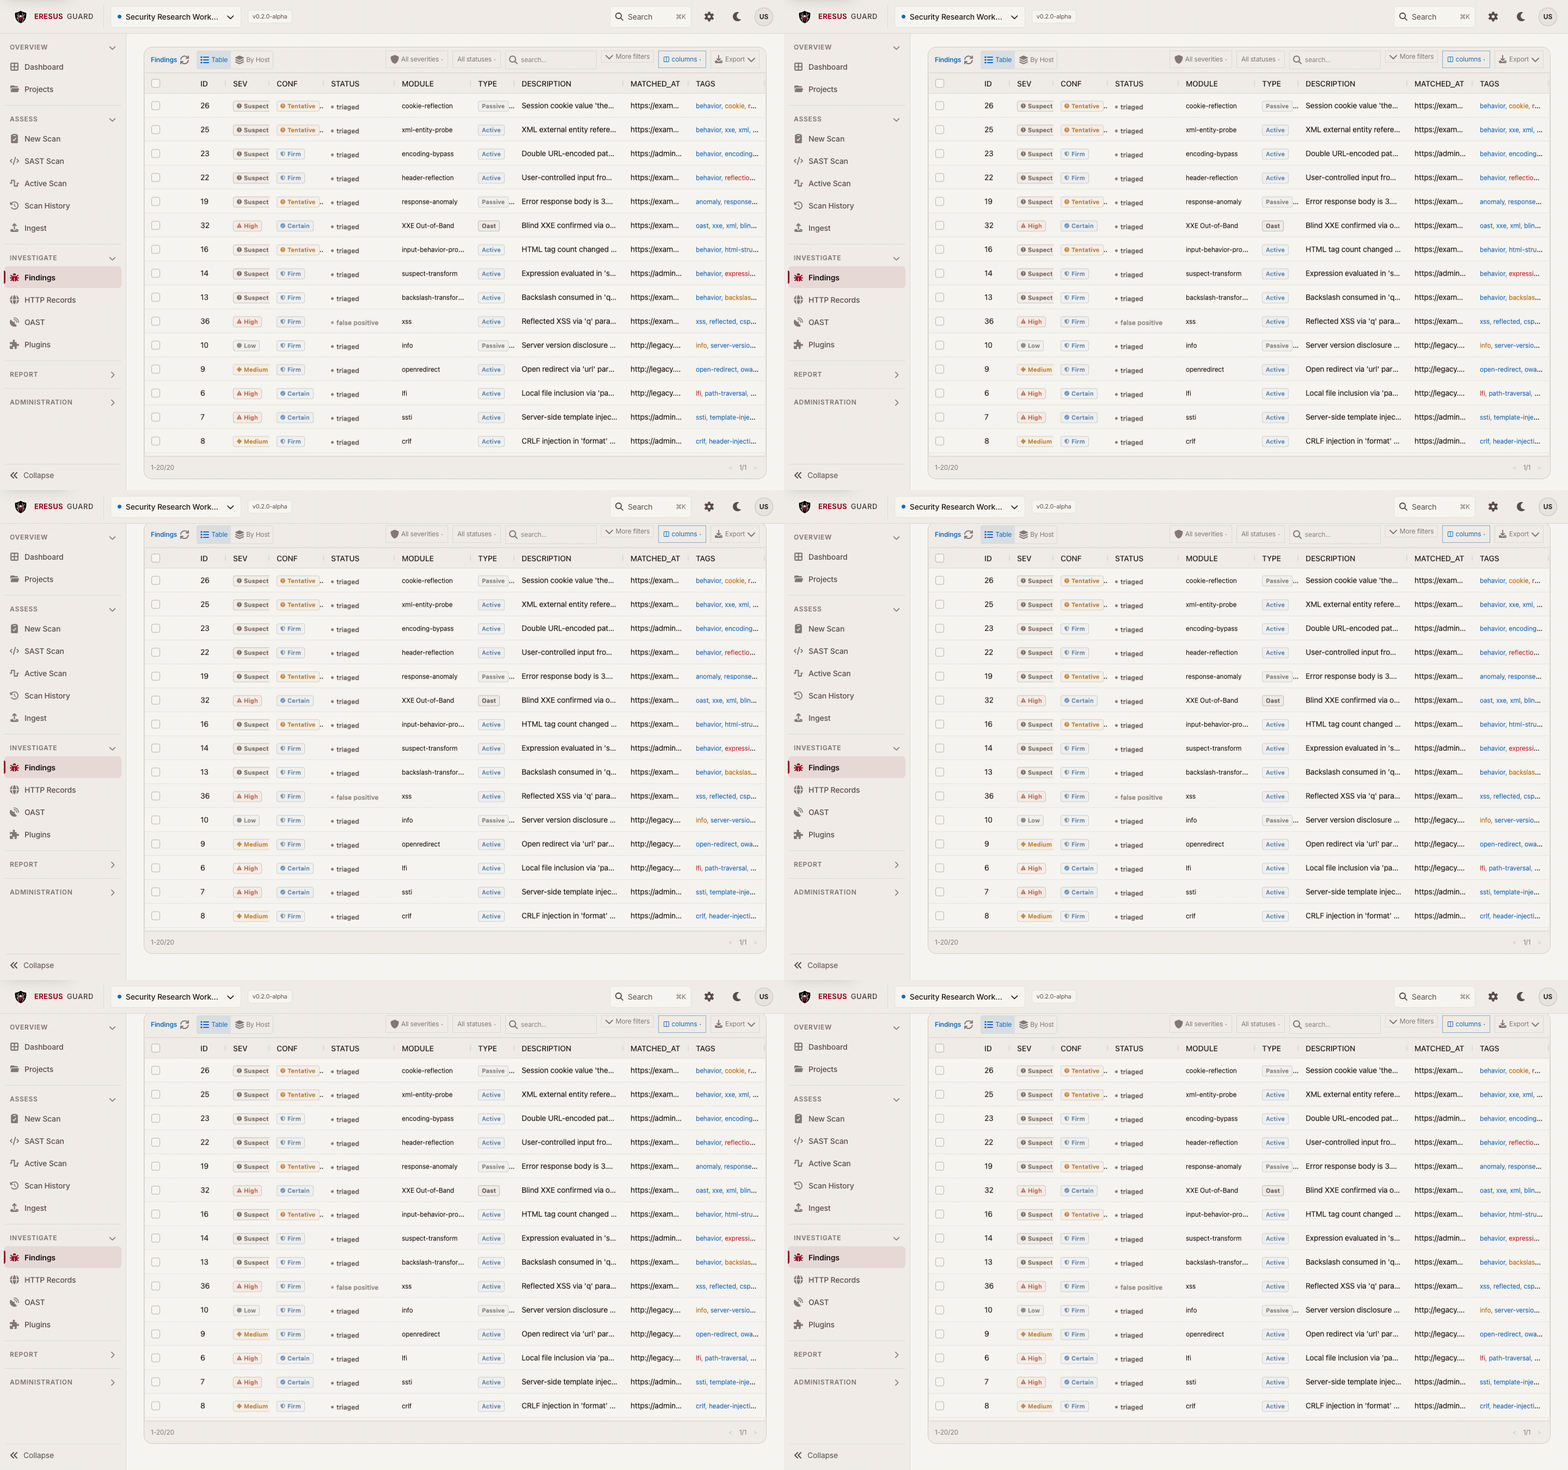
Findings is the triage list. Filter by severity, status, module, and project. Open a row for module, status, and linked HTTP or OAST evidence. Do not export a finding you have not opened.
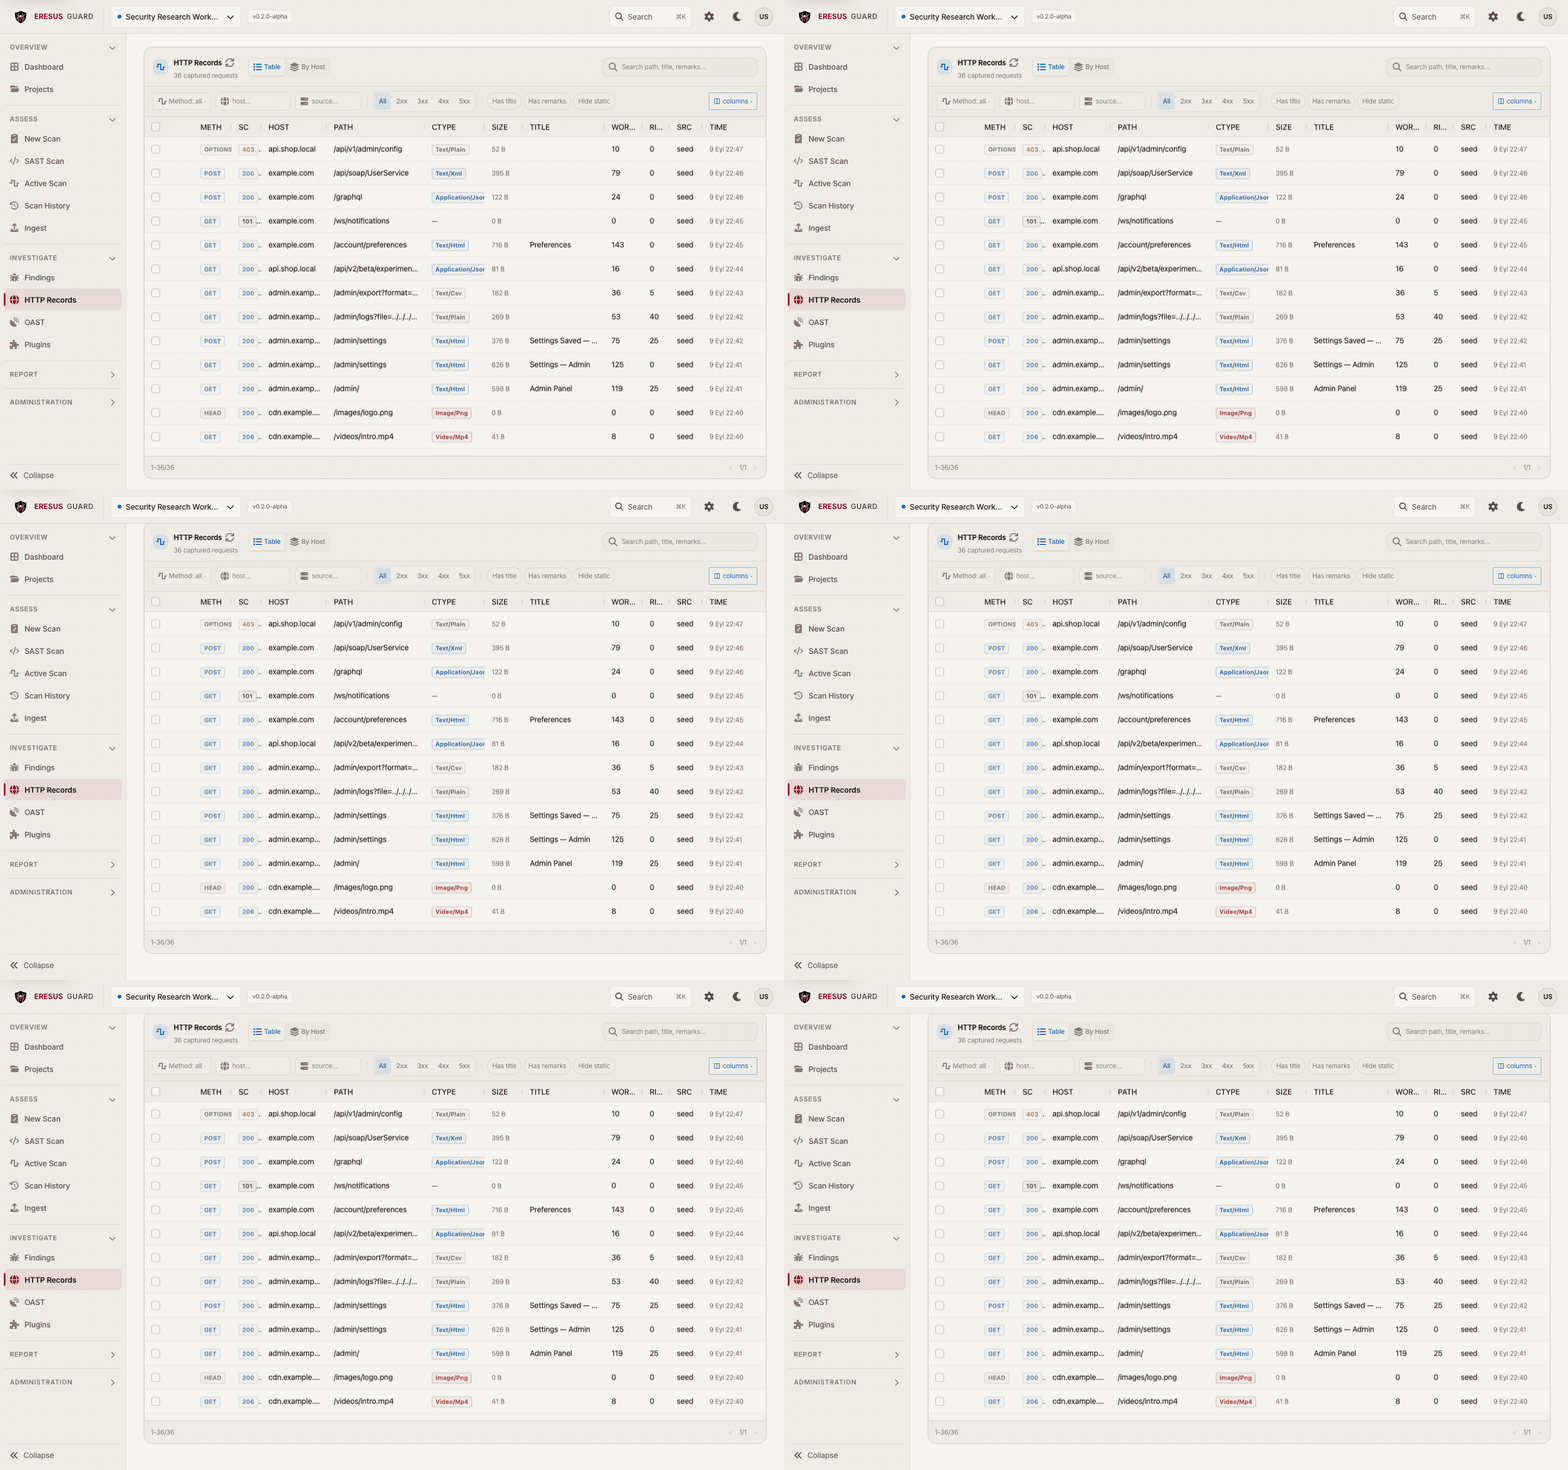
HTTP Records is the request and response trail for the same project. Use it to see what was sent, what came back, and which identity was in use. Sensitive values may be redacted; the sequence still has to be reviewable.
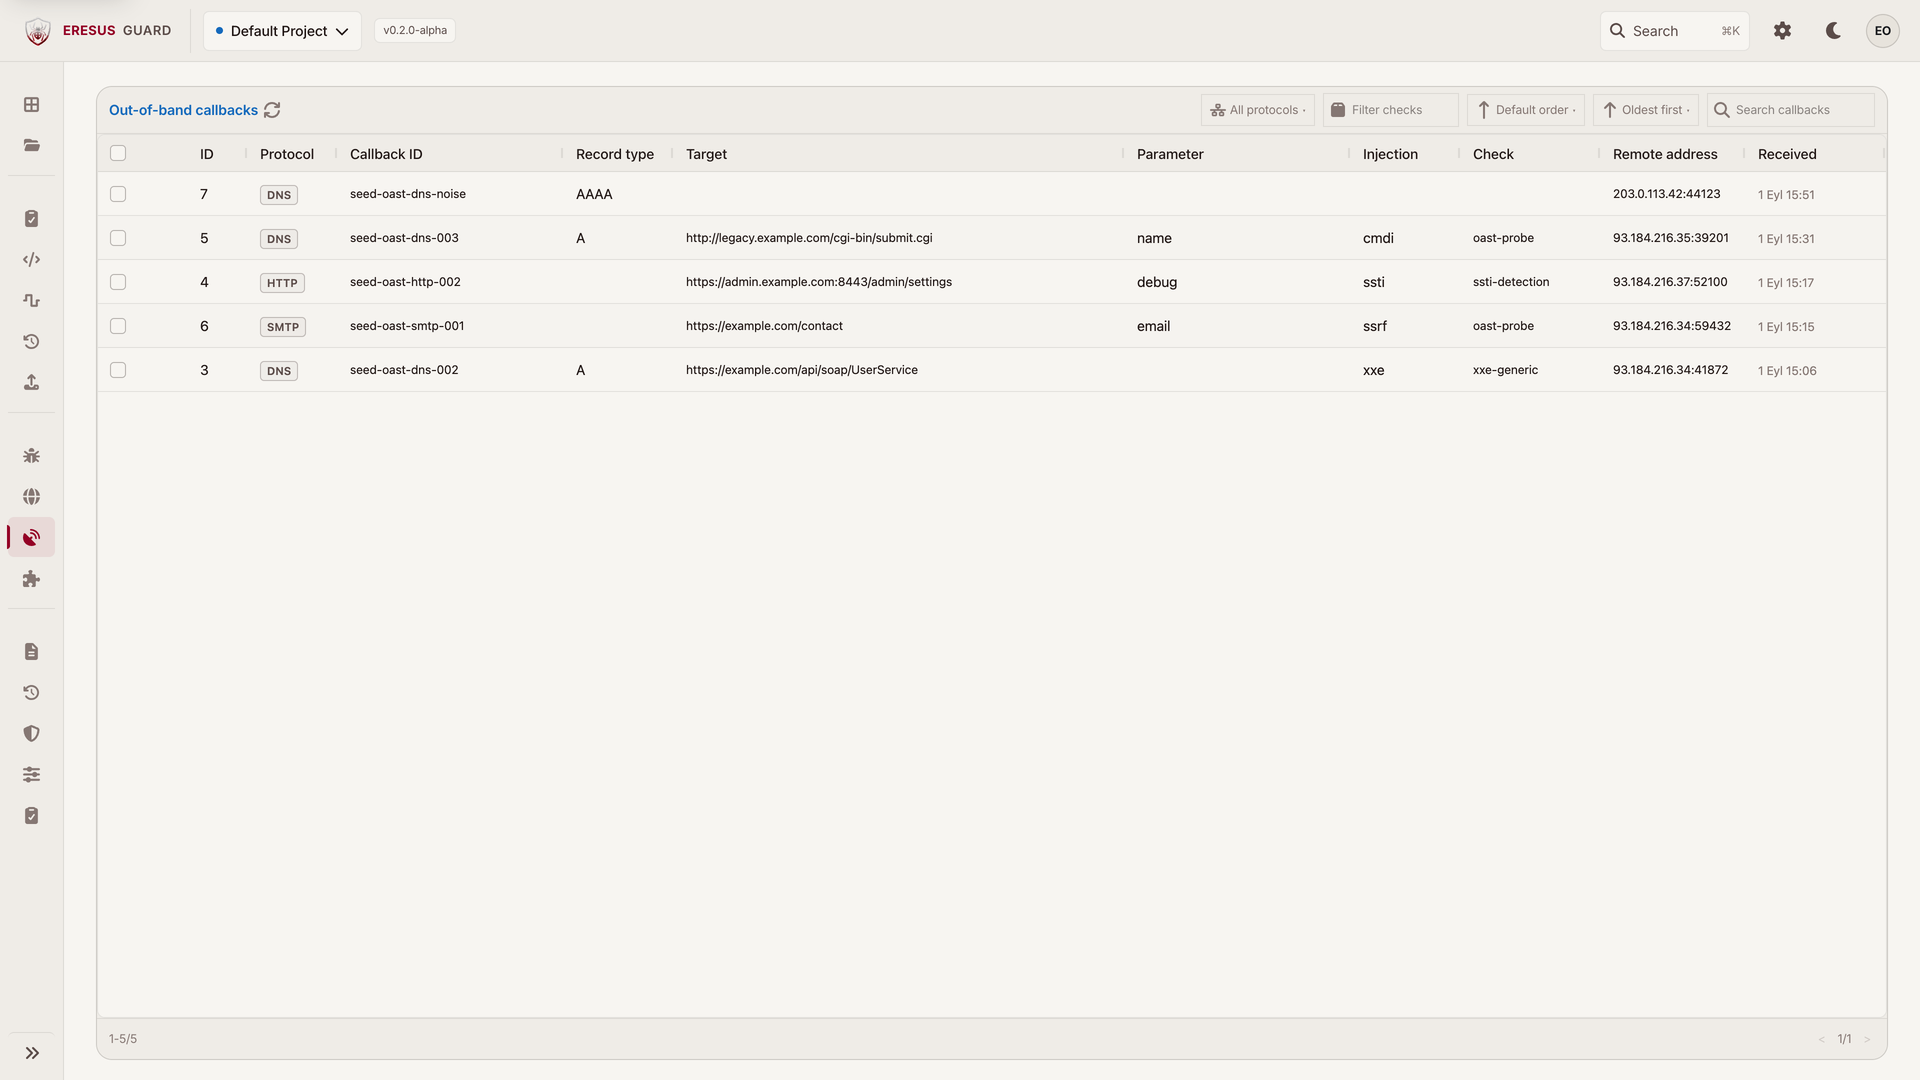
OAST is out-of-band callbacks on that trail. A callback without a reviewed finding is not a conclusion.
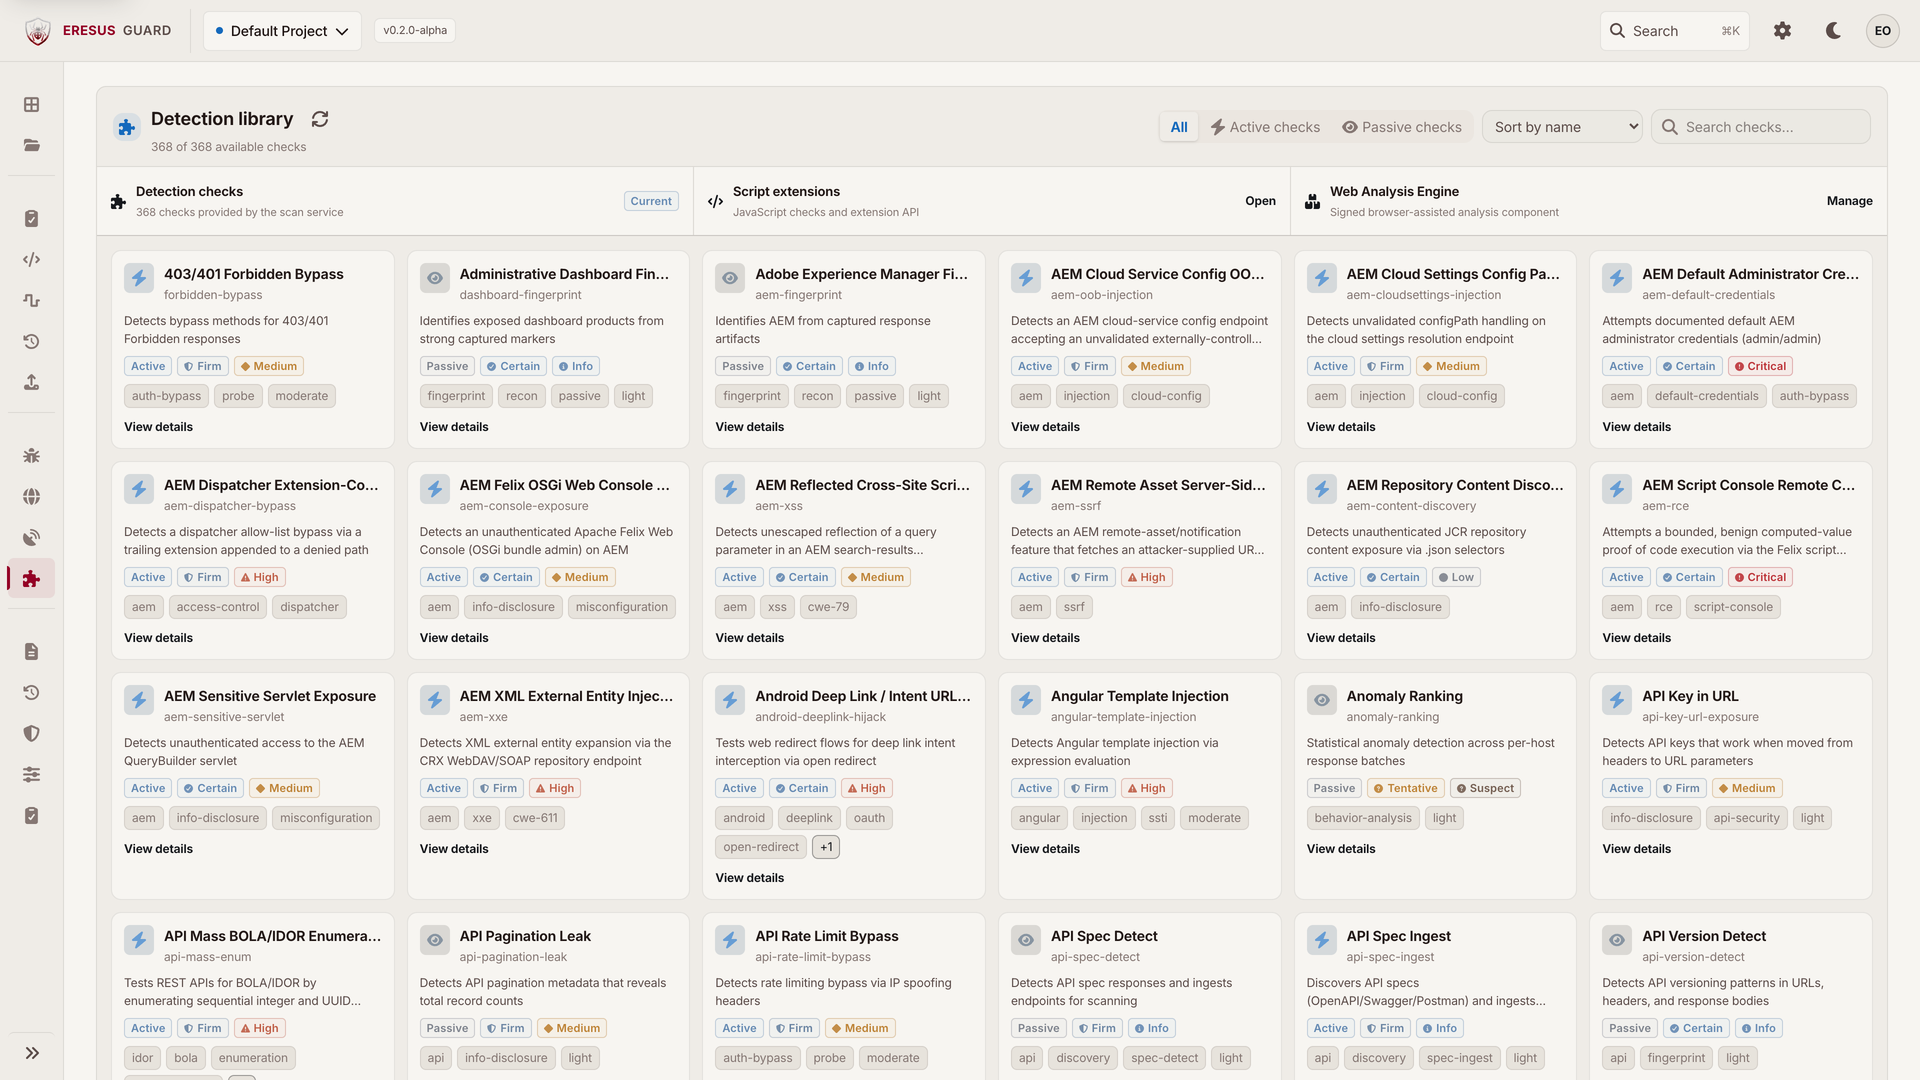
Plugins (Modules) is coverage you enable on the project. It is not a CLI catalog.
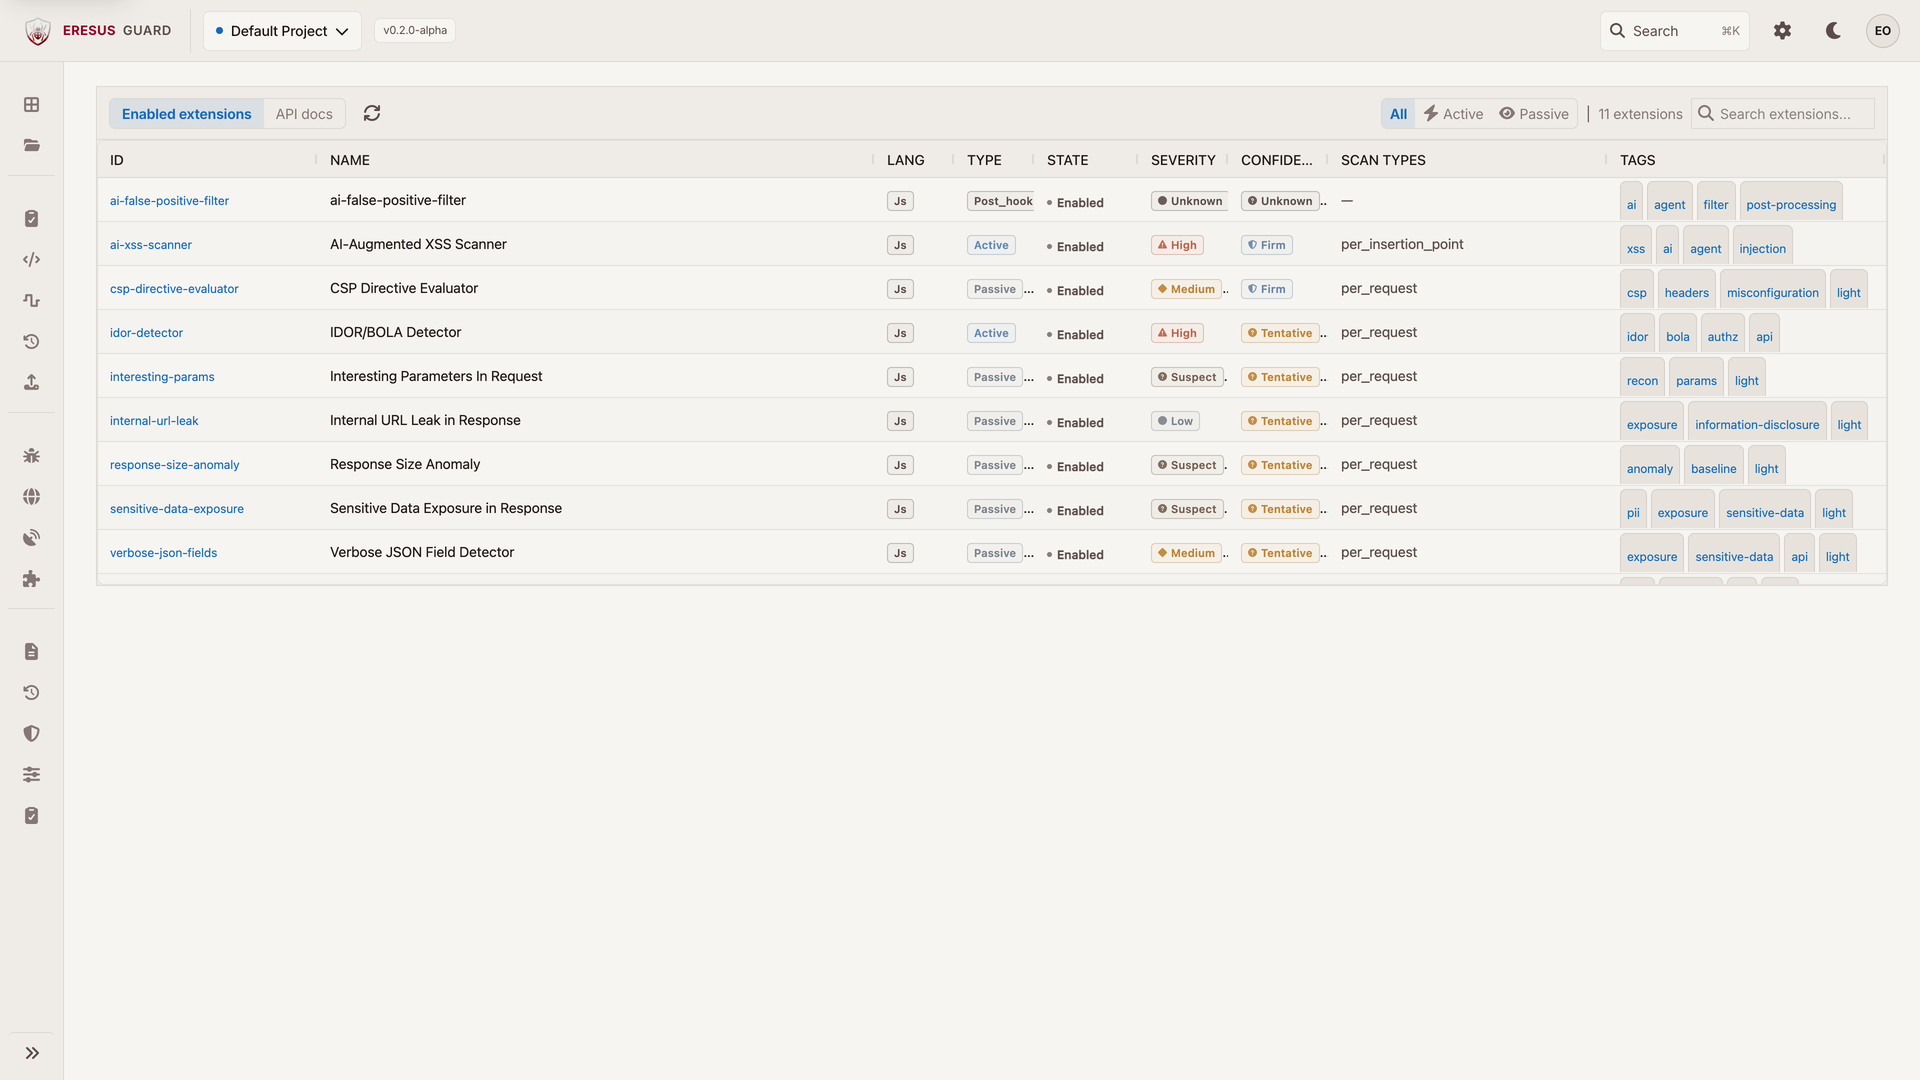
Extensions is the extension inventory for the workspace, managed in Workbench, not from a customer plugin store.
Report
Reports, Trends, OWASP, Framework Map, and SOC2 Evidence use the same project evidence. They are operator views. They are not a certification, and they are not a substitute for opening a finding.
Administration
MSSP is portfolio operations for the MSSP tier.
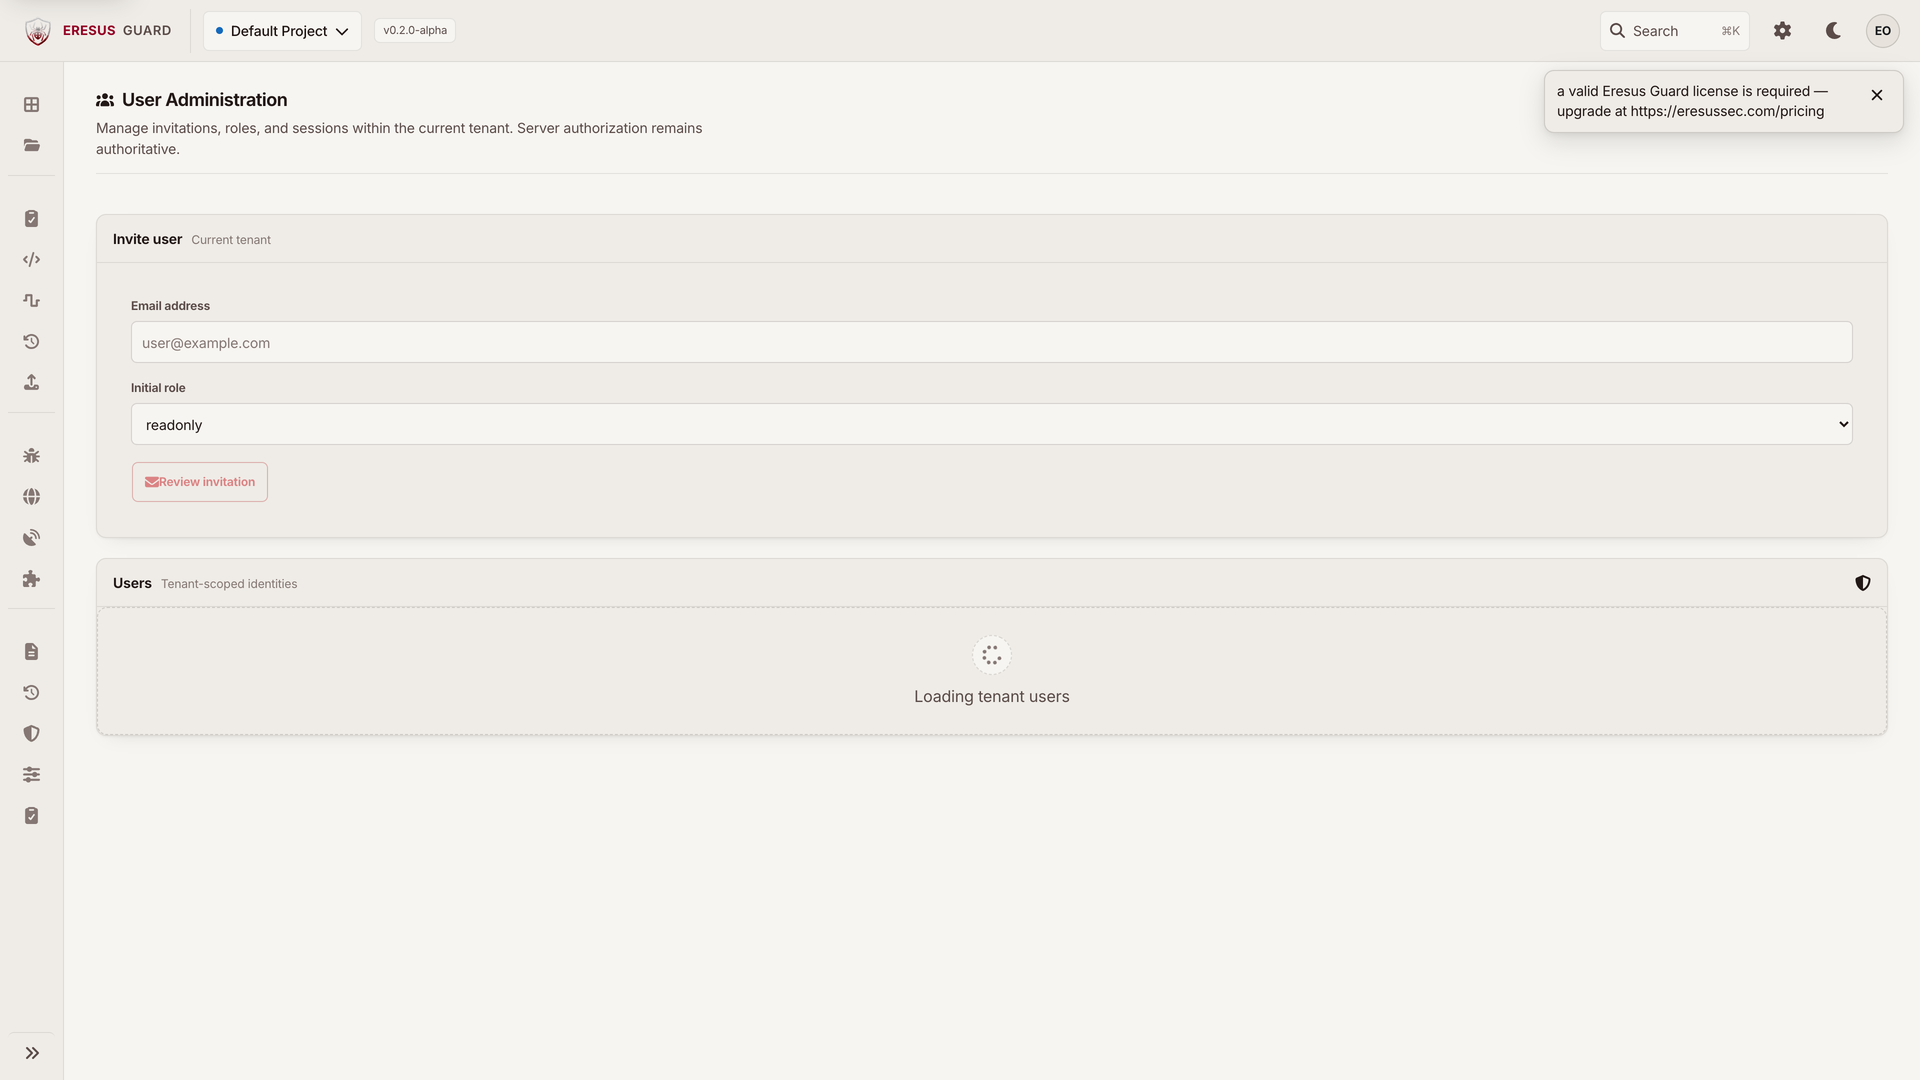
Users & RBAC is people and roles.
Authentication is OIDC/SAML for Enterprise.
CI/CD Tokens are provisioned callers. This marketing site does not list an API host.
SLA tracks open findings against the policy you saved.
Web Analysis Engine lives under Settings → Components: install, update, repair, rollback. It is a separately signed component, not embedded Chromium.
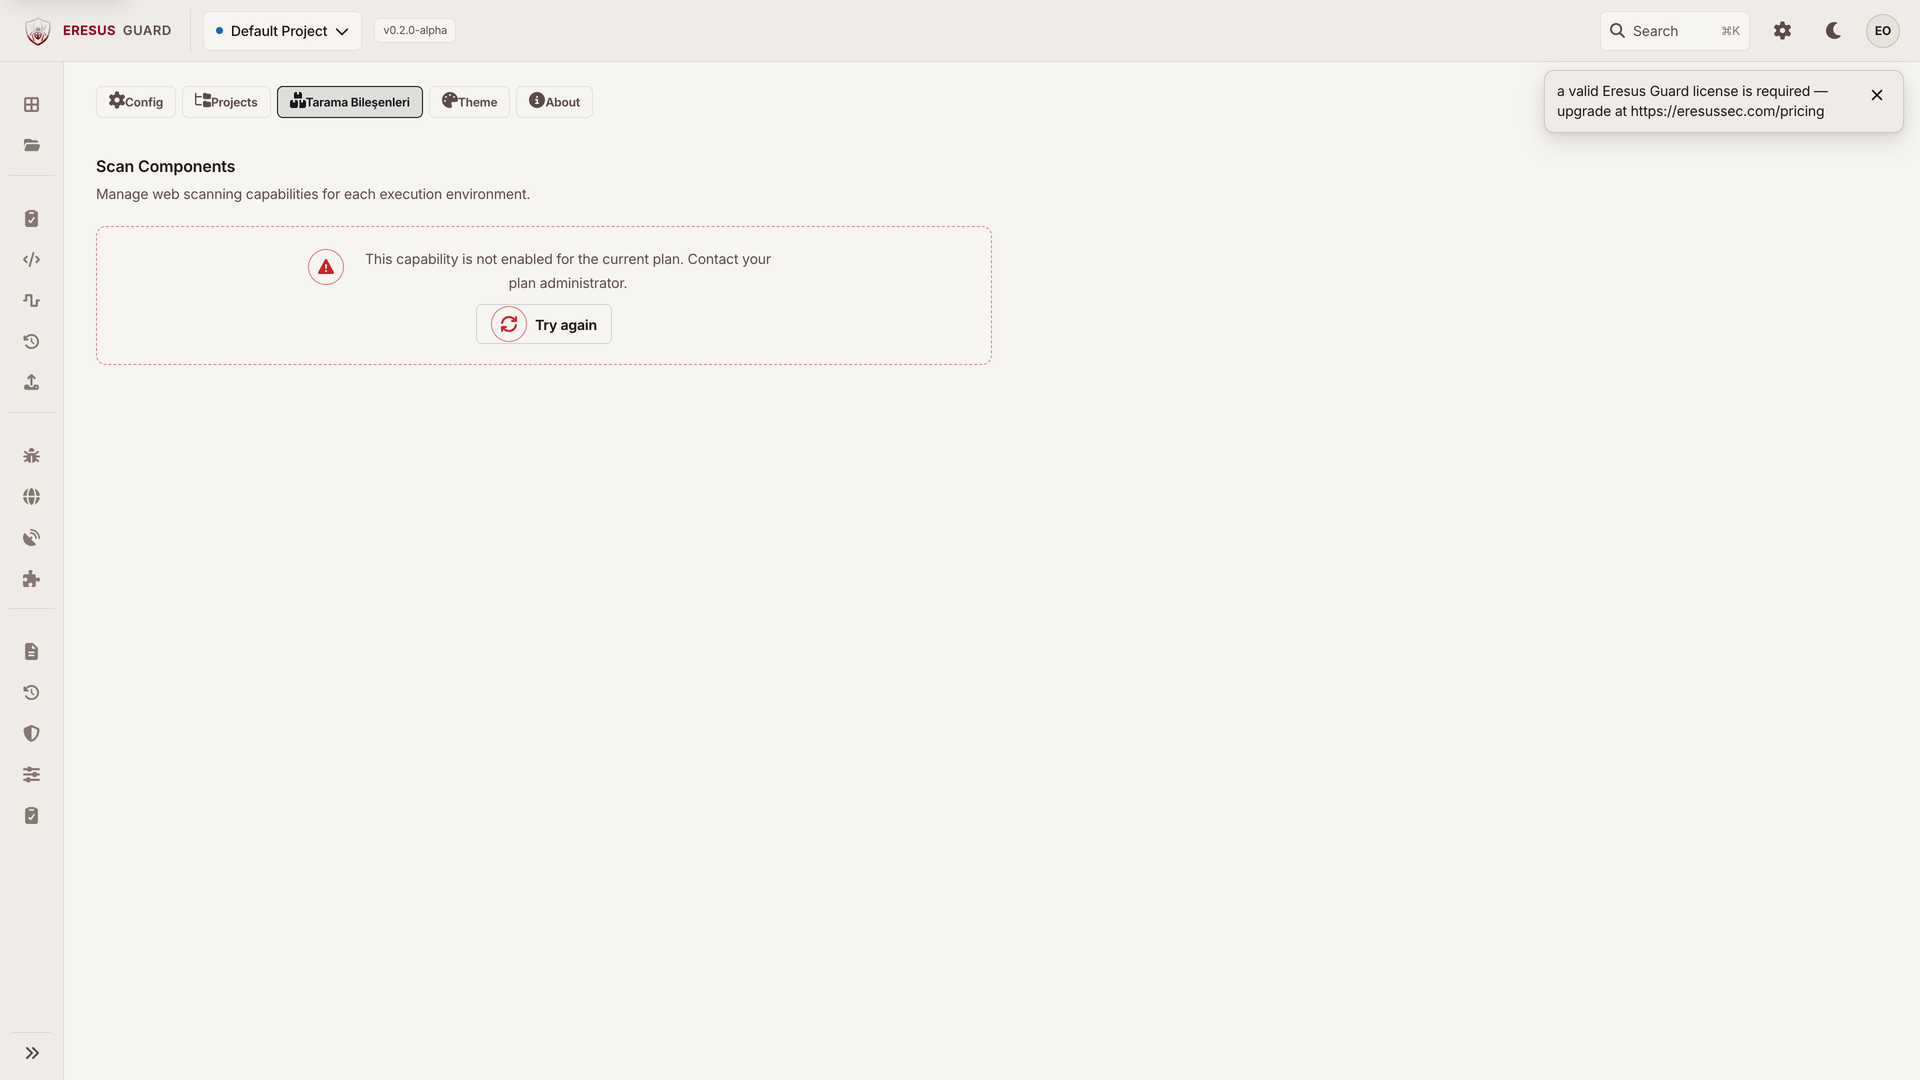
Configuration is workspace settings that belong in Workbench, not in a local scanner config file.
Related
Need a workflow that is not documented here? Email contact@eresussec.com.