Most teams get the same question from a new operator: "what actually happens when I click Start?" This walkthrough answers it directly, with real Workbench screenshots at every step, from opening the New Scan wizard to reading the finished Findings table.
Everything shown here runs against a local, illustrative demo project — not a customer target — but it is the same Workbench UI you sign into.
Step 1 — Open the New Scan wizard
From a Project, choose New Scan. The wizard has four steps: Target, Modules, Authentication, and Review. Step 1 asks for the target URL and a scan profile.
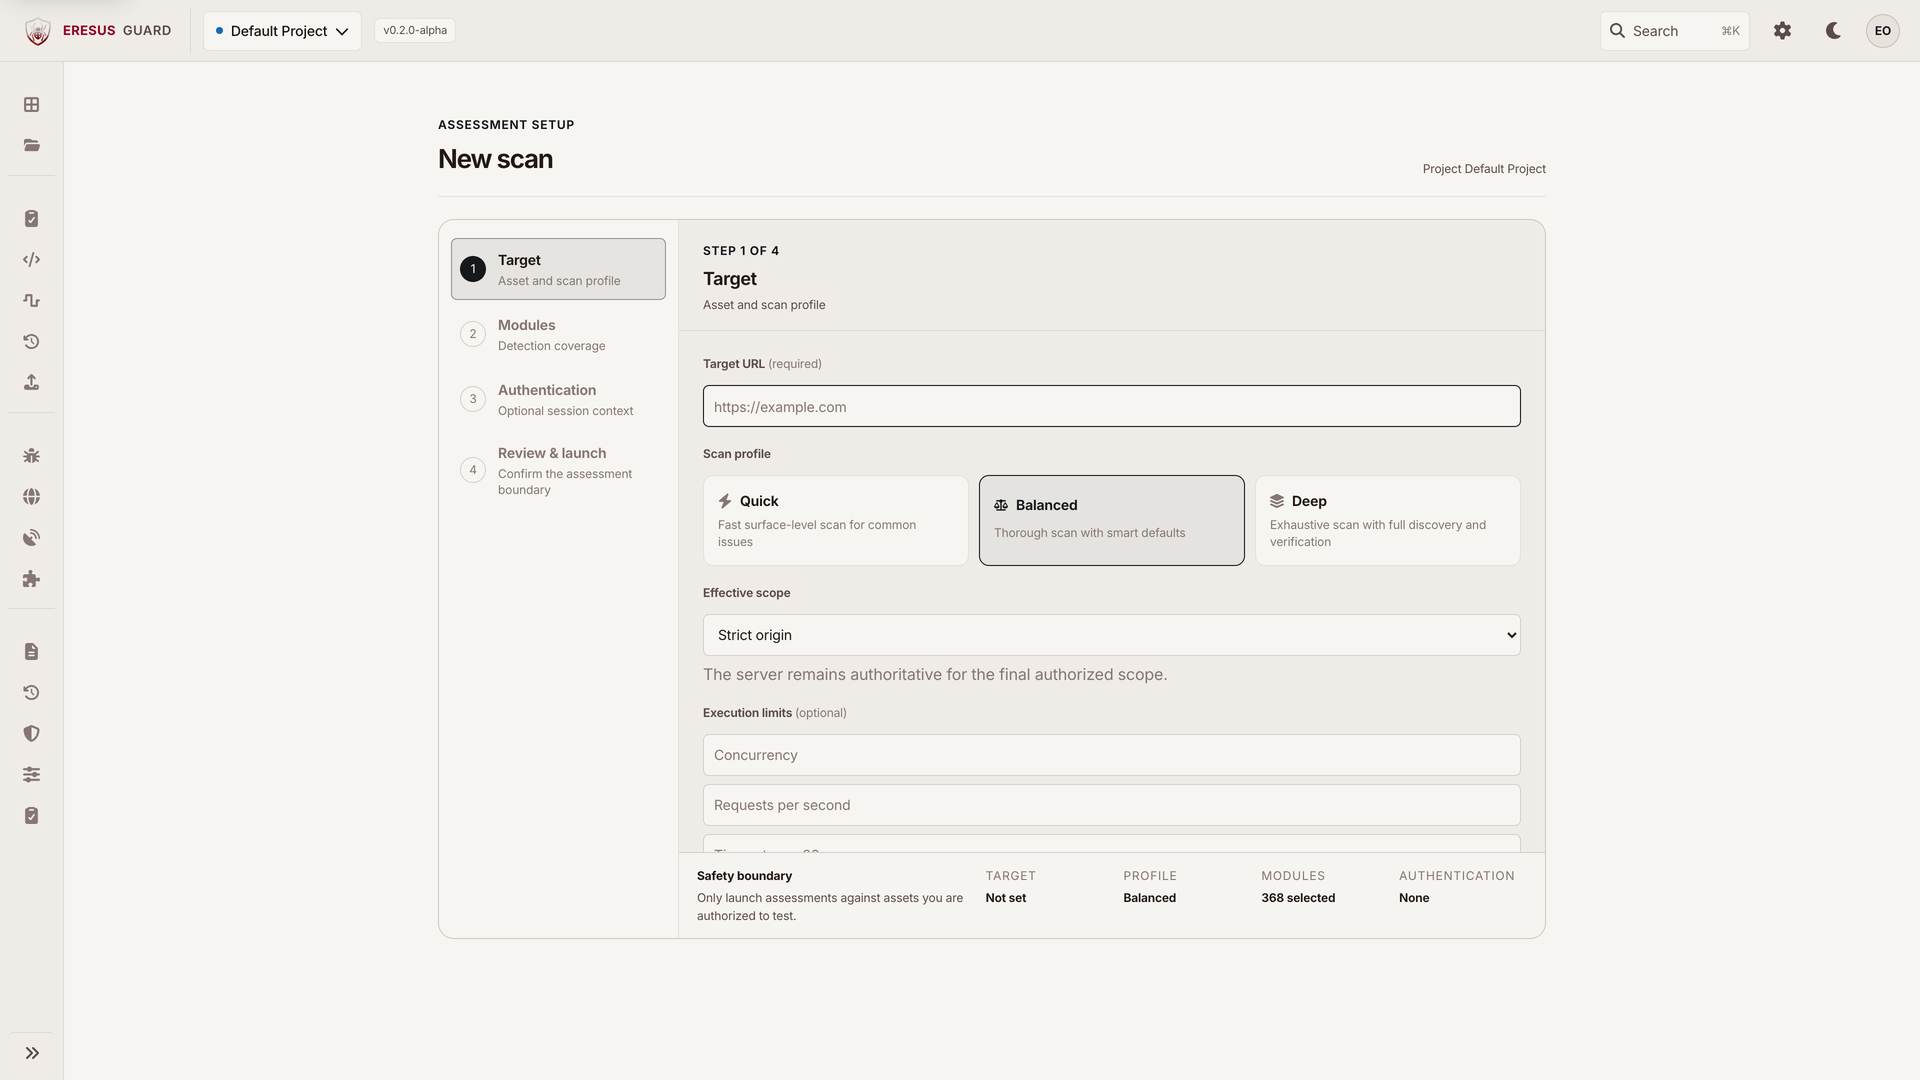
Three profiles, not one "scan everything" button. Quick favors surface-level coverage and speed. Balanced is the sane default. Deep trades time for exhaustive discovery and verification.
Pick Balanced for a first run. It's tuned to produce useful signal without overwhelming a staging environment you don't fully trust yet.
Step 2–4 — Modules, authentication, review
The remaining three steps narrow what actually gets exercised:
- Modules — which detection categories run. Leave this at the profile default on a first pass; you can always scope it down once you see what a full pass surfaces.
- Authentication — optional session context if the target requires a logged-in state. Nothing here is sent anywhere except your own Eresus Guard server.
- Review — the last screen before launch. It restates target, profile, modules, and authentication in one place. This is the moment to catch a typo'd hostname or an accidentally-included admin route, not five minutes into a running scan.
Step 3 — Watch it run from the dashboard
Once launched, the Dashboard becomes the operational home base. It shows the pipeline moving through six real stages — Scope, Context, Plan, Exercise, Verify, Proof — plus a live processed-record count and the highest-severity findings as they land.
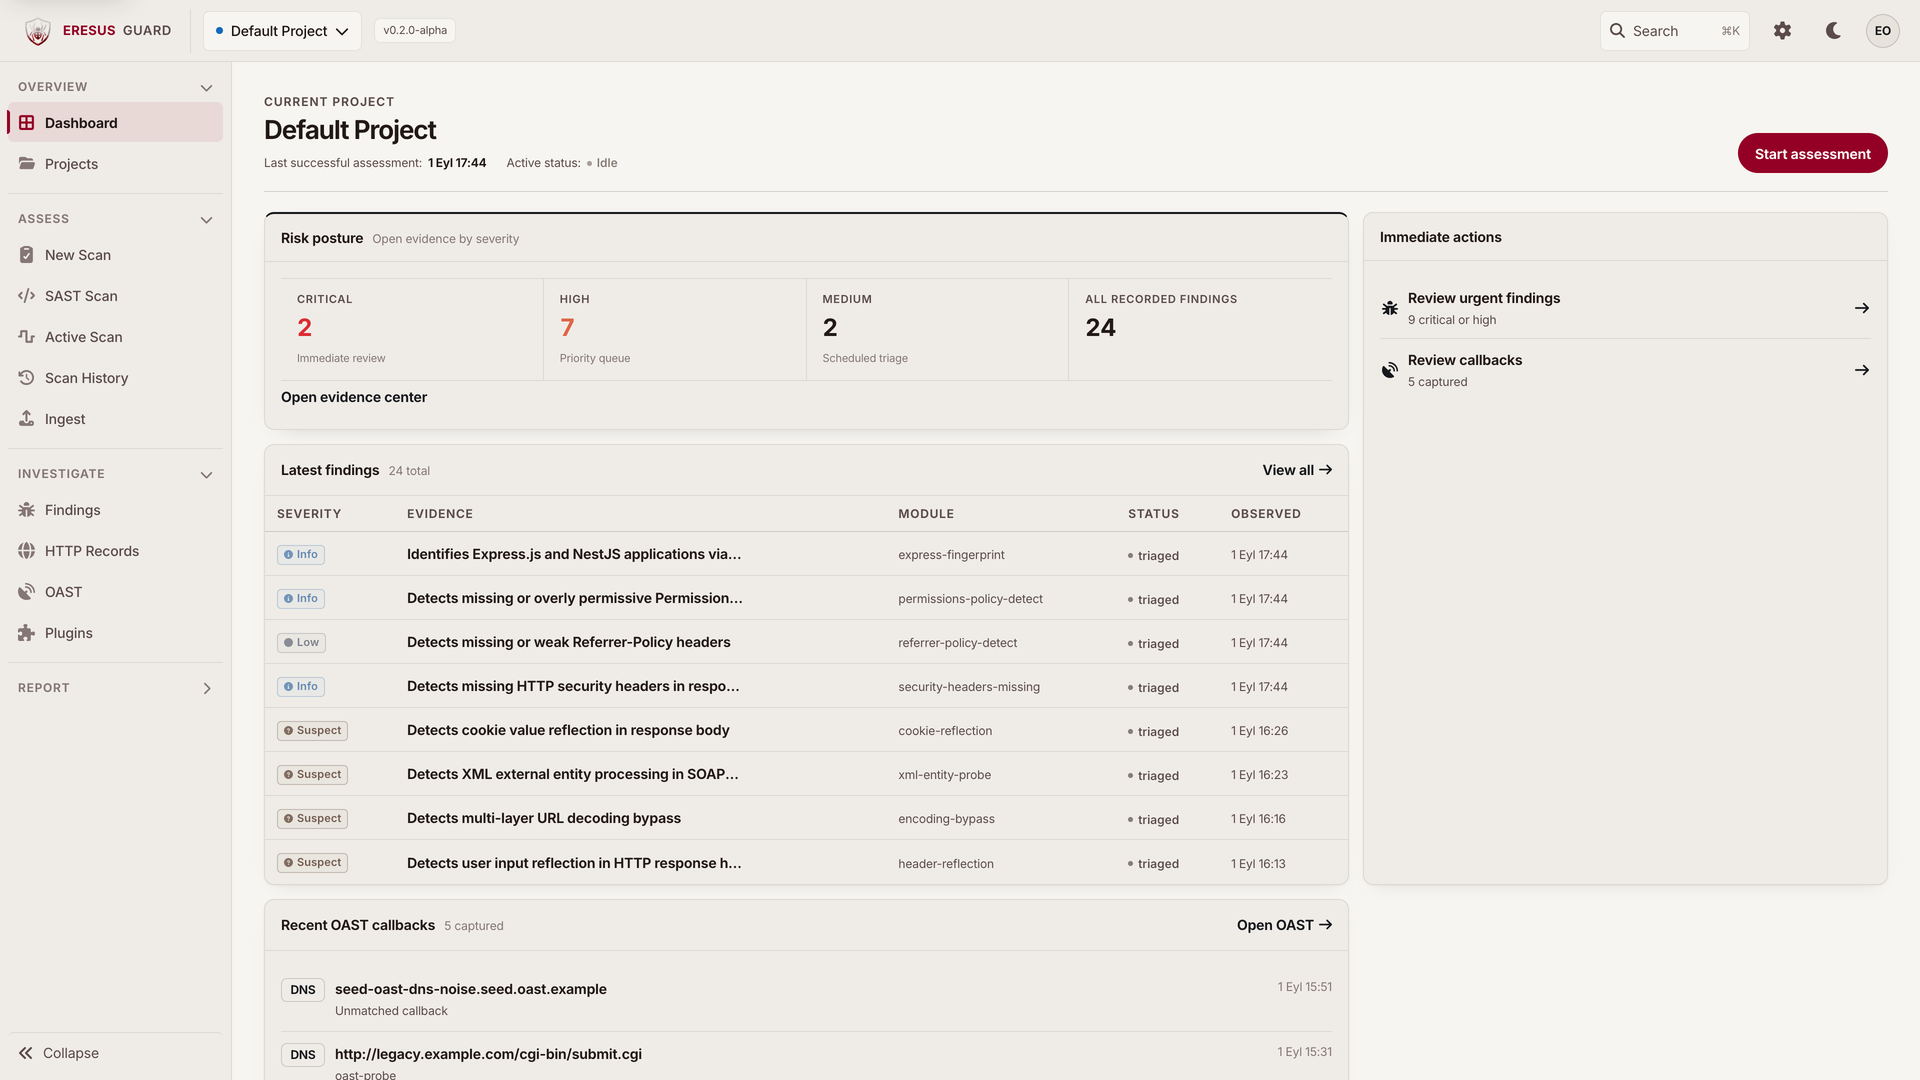
This is not a spinner. Each stage name maps to a real phase of the assessment — you can tell whether the scanner is still discovering the target or already deep into verification.
If something looks wrong — request volume spiking, error rates climbing, a login loop — pause from here. Pausing is a safety action, not a failure.
Step 4 — Read the Findings table
When the run completes, Findings is where triage happens. Every row carries severity, confidence, module, status, and a description — filterable and sortable so a critical SQL injection doesn't sit at row 340.
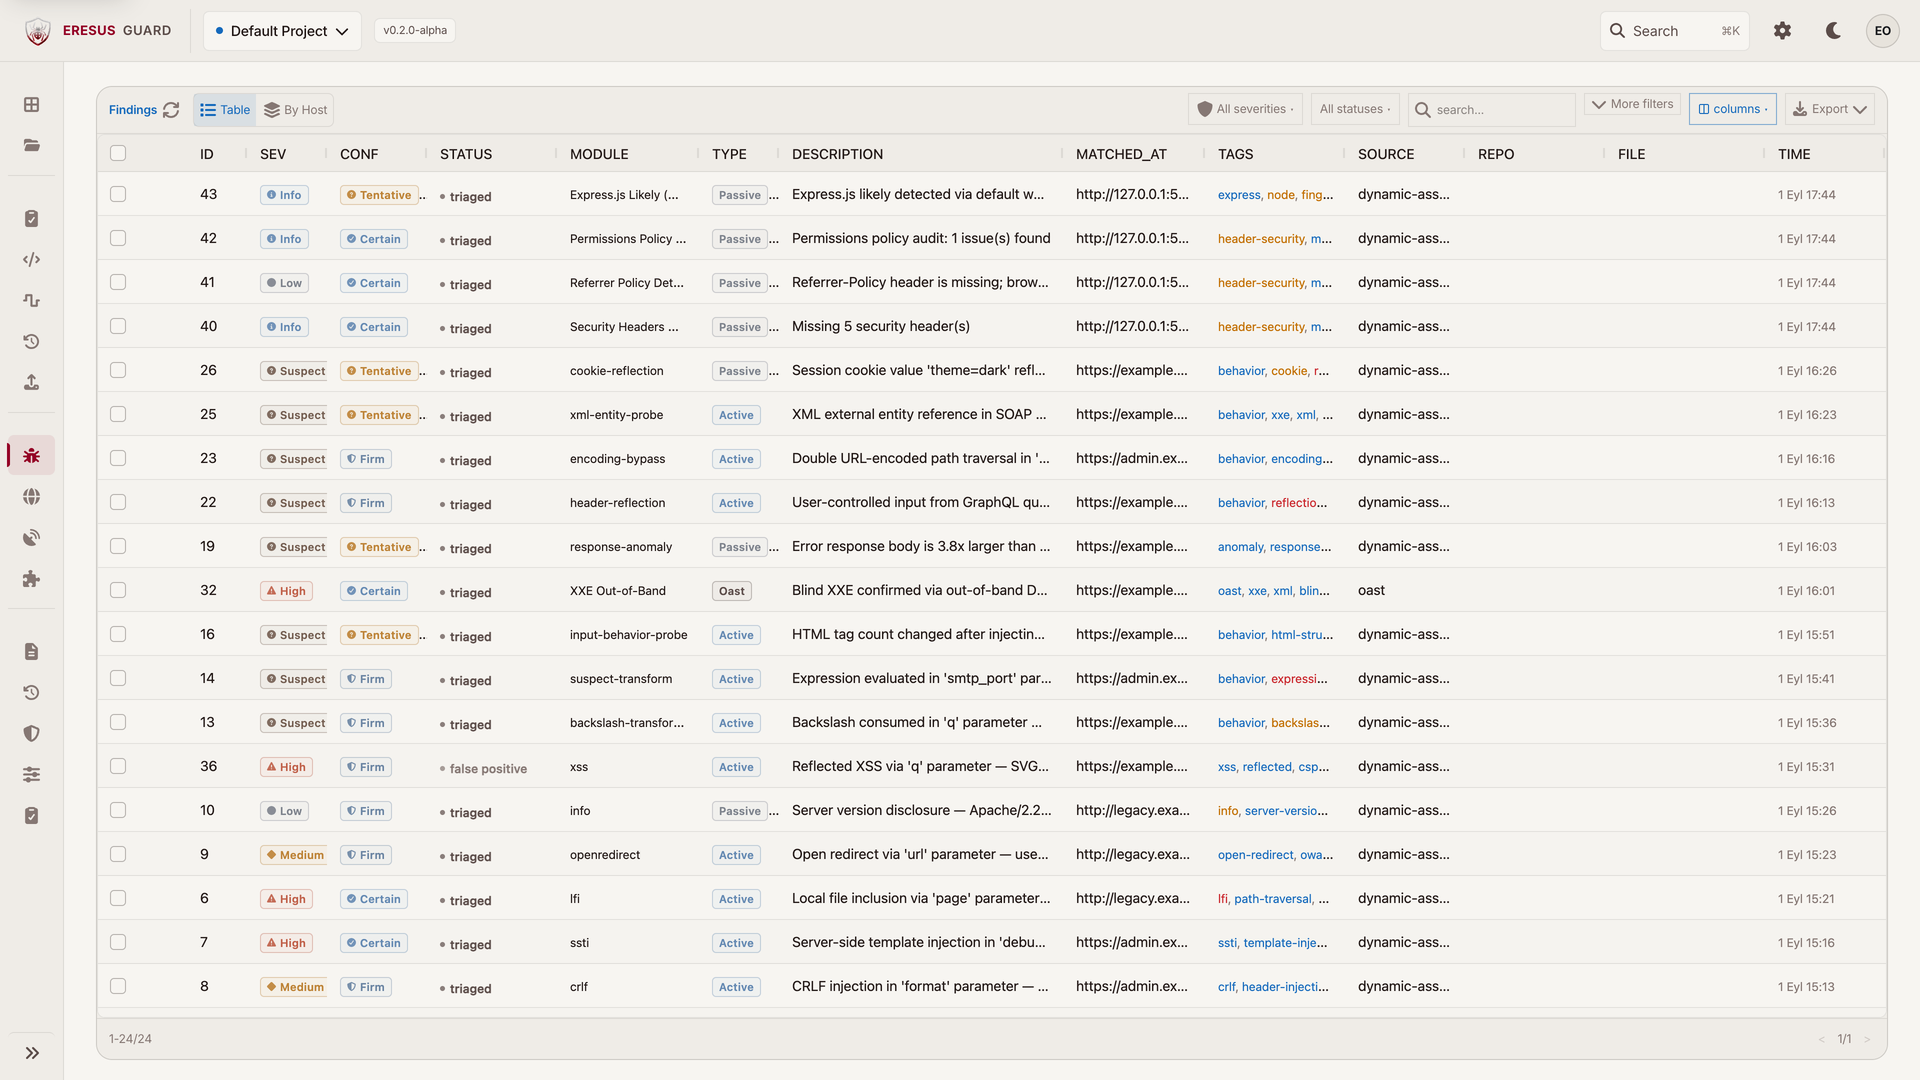
Confidence is tracked separately from severity on purpose. A "Certain / Critical" row and a "Tentative / Critical" row both deserve attention, but they don't deserve the same amount of your time before you trust them.
Click into any row and the trail leads straight to the request and response pair that produced it — no separate tool, no re-running the check by hand to sanity-check a claim.
Step 5 — Keep a real history
Every run — this one and the next fifty — stays in Scan History: status, duration, findings count, and a one-click re-run with the same project context. Nothing disappears when the browser tab closes.
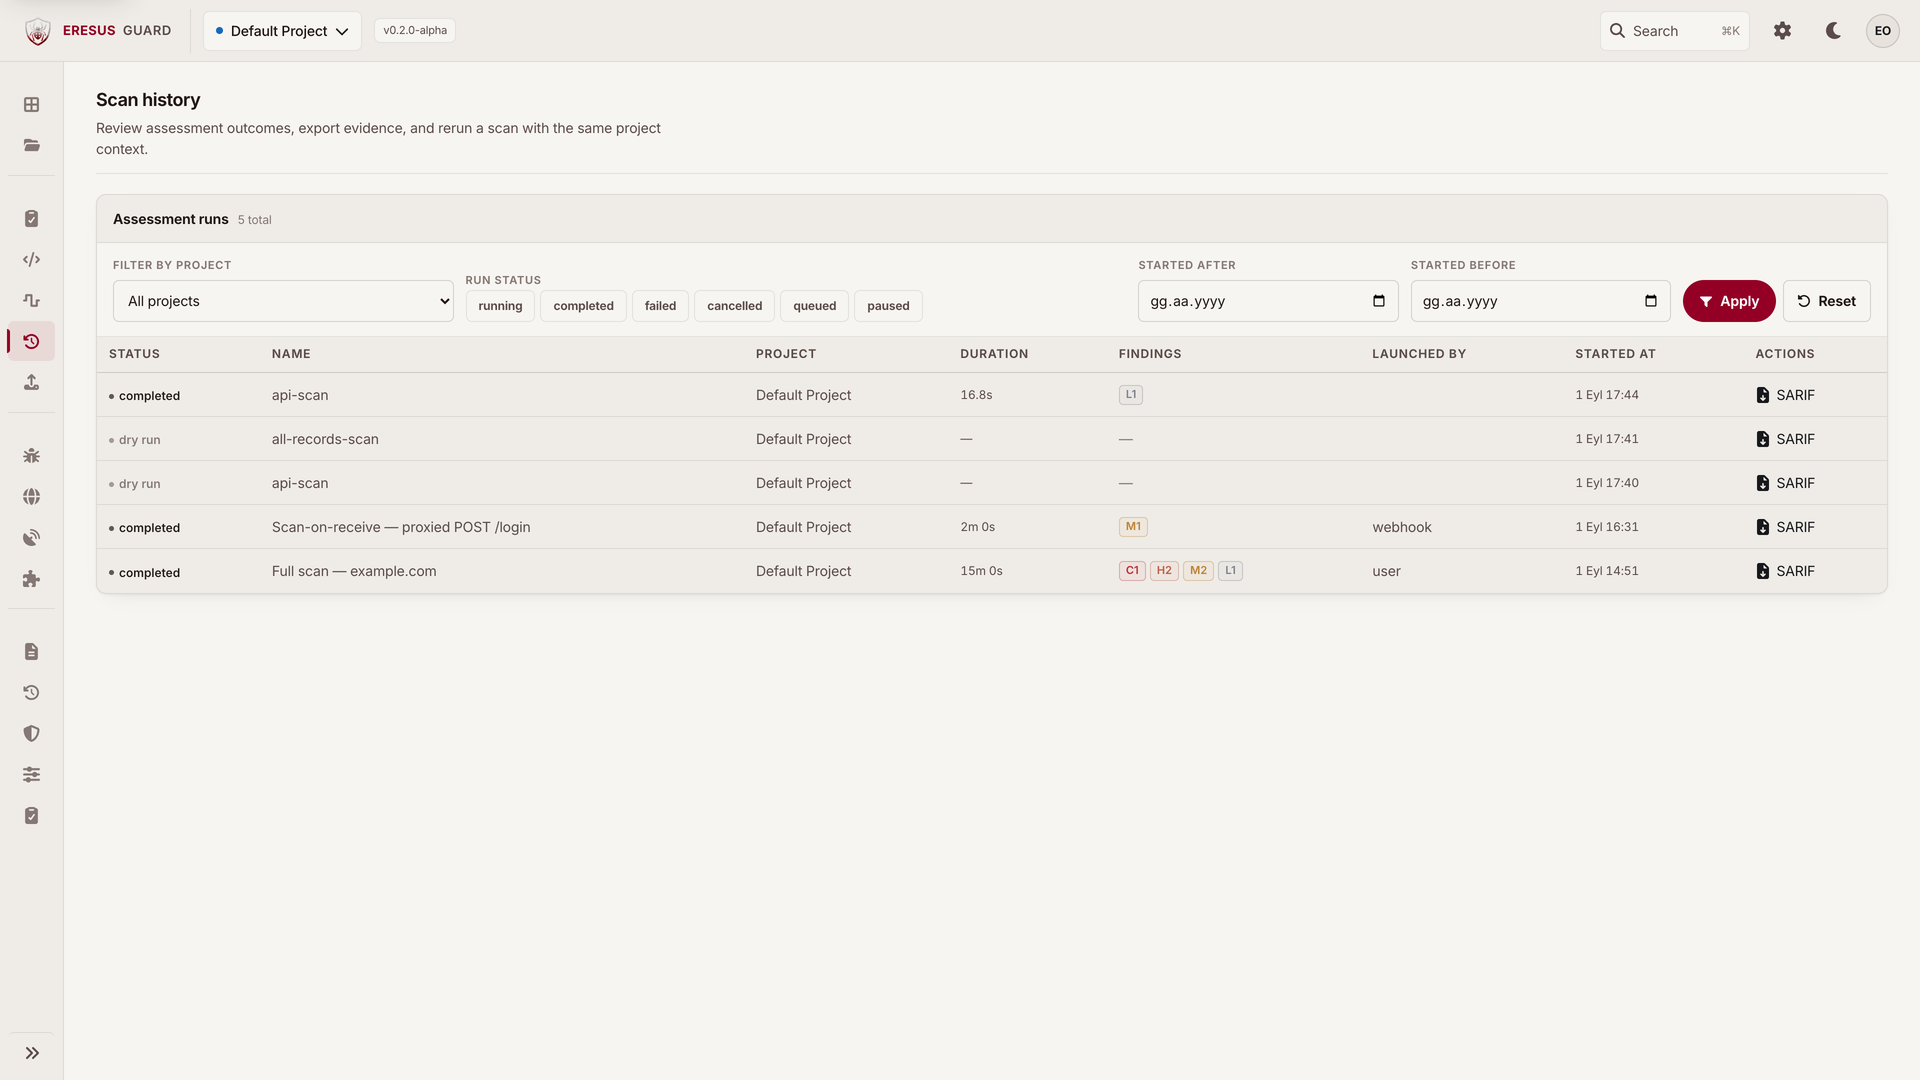
Re-run with identical settings after a fix ships, or export SARIF straight from the row for a ticketing system or CI gate — both live in this same table.
What to do next
A first run's job is to validate the operating process, not to maximize coverage. Once it looks right — the target was reachable, the profile behaved, findings triaged cleanly — move on to Native Scan for repeatable coverage, Authenticated assessments for role-aware testing, or Agent mode when a target needs more contextual investigation than a fixed profile can give it.
The full reference version of this walkthrough — with scope guidance, safety boundaries, and replay guidance — lives in Run your first assessment.